A ClickHouse cluster is a distributed database system where data is split across multiple nodes (shards) with copies on backup nodes (replicas) for fault tolerance, scalability, and high availability. This module covers deploying and managing production-grade clusters with 3 shards × 2 replicas, complete configuration management, security, SSL/TLS, and monitoring.
Cluster Architecture Diagrams
1. Full Cluster Topology (3 Shards × 2 Replicas)
👥 User Applications
Client queries & writes
⬇️
⚖️ Load Balancer
HAProxy / Nginx / Cloud LB
Ports: 9000 (TCP) | 8123 (HTTP)
⬇️
🗂️ SHARD 1
📌 Primary
Node 1 (ch1.local)
Data: 33% of total
📍 Replica
Node 2 (ch2.local)
Mirror of Shard 1
🗂️ SHARD 2
📌 Primary
Node 3 (ch3.local)
Data: 33% of total
📍 Replica
Node 4 (ch4.local)
Mirror of Shard 2
🗂️ SHARD 3
📌 Primary
Node 5 (ch5.local)
Data: 33% of total
📍 Replica
Node 6 (ch6.local)
Mirror of Shard 3
🎯 Coordination Layer
📌
Keeper 1
Leader
📋
Keeper 2
Follower
📋
Keeper 3
Follower
Total:6 ClickHouse nodes + 3 Keeper nodes| Can lose 1 node per shard + 1 Keeper
🗂️
Sharding
Data partitioned across 3 shards based on sharding key. Each shard holds 1/3 of data.
🔄
Replication
Each shard has 2 replicas for high availability. If one node fails, query data from other replica.
⚙️
Configuration
Centralized config.xml, users.xml with macros for cluster topology definition.
📋
Distributed DDL
CREATE TABLE on all shards simultaneously with ON CLUSTER keyword.
Key Concepts
Shard
A subset of your data. With 3 shards, each node stores roughly 33% of total data. Shards enable horizontal scalability.
Replica
A copy of shard data on another node. With 2 replicas per shard, you have redundancy and can tolerate 1 node failure.
Distributed Table
A virtual table that queries all shards. When you query it, ClickHouse parallelizes queries across all shards.
ClickHouse Keeper
Coordinates replication. All replicated tables need Keeper to synchronize data and handle failover.
3 Shards × 2 Replicas Topology
Shard
Replica 1
Replica 2
Data Size
Fault Tolerance
Shard 1
ch-node-1 (ch1.local:9000)
ch-node-2 (ch2.local:9000)
~33% of total
1 node failure
Shard 2
ch-node-3 (ch3.local:9000)
ch-node-4 (ch4.local:9000)
~33% of total
1 node failure
Shard 3
ch-node-5 (ch5.local:9000)
ch-node-6 (ch6.local:9000)
~33% of total
1 node failure
🚀 Quick Start: Deploy 3×2 Cluster
Step 1: Install ClickHouse & ClickHouse Keeper on All 6 Nodes
# Run on each node (ch1 through ch6)
sudo apt-get update
sudo apt-get install -y apt-transport-https ca-certificates

curl -fsSL 'https://packages.clickhouse.com/rpm/lts/repodata/repomd.xml.key' \
  | sudo gpg --dearmor -o /usr/share/keyrings/clickhouse-keyring.gpg

echo "deb [signed-by=/usr/share/keyrings/clickhouse-keyring.gpg] \
  https://packages.clickhouse.com/deb stable main" \
  | sudo tee /etc/apt/sources.list.d/clickhouse.list

sudo apt-get update
sudo apt-get install -y clickhouse-server clickhouse-client clickhouse-keeper
Step 2: Configure ClickHouse Keeper Cluster
Edit /etc/clickhouse-keeper/keeper_config.xml on nodes ch1, ch2, ch3:
# Start Keeper on ch1, ch2, ch3
sudo systemctl start clickhouse-keeper
sudo systemctl enable clickhouse-keeper

# Verify Keeper cluster status
echo "ruok" | nc ch1.local 9181

# Start ClickHouse on all nodes
sudo systemctl start clickhouse-server
sudo systemctl enable clickhouse-server

# Test connection
clickhouse-client --host ch1.local -q "SELECT 1"
💻 Commands Reference
Cluster Management Commands
-- View cluster topology
SELECT * FROM system.clusters;

-- Check cluster health
SELECT host_name, host_address, port
FROM system.clusters
WHERE cluster_name = 'my_cluster';

-- List all running queries across cluster
SELECT hostname(), *
FROM clusterAllReplicas('my_cluster', system.processes);

-- Kill query on cluster
KILL QUERY ON CLUSTER 'my_cluster' WHERE query_id = 'xxx';
Distributed Table Creation
-- Create database on all shards
CREATE DATABASE IF NOT EXISTS events ON CLUSTER 'my_cluster';

-- Create replicated table on all shards
CREATE TABLE IF NOT EXISTS events ON CLUSTER 'my_cluster' (
    event_date Date,
    event_time DateTime,
    user_id UInt32,
    event_type String,
    country String
) ENGINE = ReplicatedMergeTree(
    '/clickhouse/tables/{shard}/events',
    '{replica}'
)
PARTITION BY toYYYYMM(event_date)
ORDER BY (event_date, user_id);

-- Create distributed table (virtual layer over all shards)
CREATE TABLE IF NOT EXISTS events_distributed ON CLUSTER 'my_cluster'
AS events
ENGINE = Distributed(
    'my_cluster',
    'events',
    'events',
    rand()  -- Sharding key
);

-- Insert data into distributed table (auto-sharded)
INSERT INTO events_distributed VALUES
    ('2026-01-22', '2026-01-22 10:00:00', 1001, 'click', 'US'),
    ('2026-01-22', '2026-01-22 10:01:00', 1002, 'purchase', 'UK');

-- Query distributed table (queries all shards in parallel)
SELECT country, COUNT(*) as event_count
FROM events_distributed
WHERE event_date = '2026-01-22'
GROUP BY country;
Monitoring & Health Checks
-- Check replication status on each node
SELECT
    database,
    table,
    is_leader,
    is_readonly,
    absolute_delay,
    future_parts,
    parts_to_check
FROM system.replicas;

-- Check disk usage per shard
SELECT
    database,
    table,
    sum(bytes_on_disk) as disk_used,
    formatReadableSize(disk_used) as human_readable
FROM system.parts
WHERE active = 1
GROUP BY database, table
ORDER BY disk_used DESC;

-- Monitor merge operations
SELECT
    database,
    table,
    count() as merge_count,
    max(create_time) as latest_merge
FROM system.merges
GROUP BY database, table;

-- Check running queries
SELECT
    user,
    query_id,
    query,
    elapsed
FROM system.processes;
✨ Best Practices
1. Cluster Topology Design
❌ Bad
-- Single shard, single replica
-- No redundancy or scalability
CREATE TABLE events (...)
ENGINE = MergeTree();
Problem: No high availability, data loss on failure
✅ Good
-- 3 shards × 2 replicas
-- Data distributed, replicated for HA
CREATE TABLE events ON CLUSTER 'my_cluster' (...)
ENGINE = ReplicatedMergeTree(
    '/clickhouse/tables/{shard}/events',
    '{replica}'
);
Benefit: Scales to PB of data, tolerates 1 node failure per shard
2. Network & Firewall Configuration
Required Ports
9000: ClickHouse TCP (node-to-node)
8123: HTTP interface
9009: Inter-cluster replication
9181: Keeper client port
9234: Keeper Raft protocol
Firewall Rules
# Allow TCP 9000 between cluster nodes
sudo ufw allow from 192.168.1.0/24 to any port 9000

# Allow TCP 8123 from app servers
sudo ufw allow from 10.0.0.0/8 to any port 8123

# Allow Keeper cluster
sudo ufw allow from 192.168.1.0/24 to any port 9181
sudo ufw allow from 192.168.1.0/24 to any port 9234
-- Set query timeout (15 minutes)
SET max_execution_time = 900;

-- Set memory limit (5 GB)
SET max_memory_usage = 5000000000;

-- Set result row limit
SET max_result_rows = 10000000;
5. Monitoring & Alerting
Essential Metrics to Monitor
Replication Lag: Monitor absolute_delay in system.replicas
Disk Usage: Alert when > 80% full
Query Latency: Track p95/p99 query times
Connection Count: Alert on connection pool exhaustion
Keeper Health: Ensure quorum is healthy (3/3 nodes)
Merge Operations: Monitor active merge count and duration
🎯 When to Use Cluster Deployment
✅ Use Clusters When
Data exceeds single node capacity (TB+ scale)
Need high availability and fault tolerance
Multiple query users accessing simultaneously
Need to scale horizontally
Running mission-critical analytics
Need rolling updates without downtime
Data ingestion rate exceeds single node capacity
❌ Single Node Sufficient When
Data < 1TB
Development/testing environment
Limited budget for infrastructure
Query volume is low
Data loss acceptable
No high availability requirement
Batch processing only
🏆 Real-World Results
3x
Query Parallelization
3-shard cluster processes queries 3x faster through parallelization across shards
99.99%
Availability
With 2 replicas per shard, cluster tolerates 50% node failures and continues operating
PB Scale
Storage Capacity
Linear scaling - add nodes to grow storage capacity
Sub-1sec
Query Latency
Distributed queries on massive datasets return in under 1 second
Template 2: Production Events Table with Distributed Variant
-- Create replicated table on all shards
CREATE TABLE IF NOT EXISTS events ON CLUSTER 'prod_cluster' (
    event_date Date,
    event_time DateTime,
    user_id UInt64,
    event_type LowCardinality(String),
    country LowCardinality(String),
    city String,
    platform LowCardinality(String),
    revenue Decimal(10, 2) DEFAULT 0,
    properties String  -- JSON
) ENGINE = ReplicatedMergeTree(
    '/clickhouse/tables/{shard}/events',
    '{replica}'
)
PARTITION BY toYYYYMM(event_date)
ORDER BY (event_date, user_id, event_type)
TTL event_date + INTERVAL 12 MONTH;

-- Create distributed table for queries
CREATE TABLE IF NOT EXISTS events_distributed ON CLUSTER 'prod_cluster'
AS events
ENGINE = Distributed('prod_cluster', 'events', 'events', cityHash64(user_id));
🔥 Advanced Patterns
1. Zero-Downtime Rolling Updates
-- Strategy: Update one node at a time, maintain availability

-- 1. Stop writes to node ch1
ALTER TABLE events DETACH REPLICA 'ch1' ON CLUSTER 'prod_cluster';

-- 2. Update ClickHouse binary on ch1
sudo apt-get update
sudo apt-get install --only-upgrade clickhouse-server

-- 3. Restart ClickHouse on ch1
sudo systemctl restart clickhouse-server

-- 4. Reattach replica (catches up from other replicas)
ALTER TABLE events ATTACH REPLICA 'ch1' ON CLUSTER 'prod_cluster';

-- 5. Verify replication lag is 0
SELECT database, table, absolute_delay
FROM system.replicas
WHERE hostname() = 'ch1';
2. Handling Node Failures
-- If ch1 (replica in shard 1) fails:
-- 1. All queries automatically route to ch2
-- 2. Data is still available on ch2
-- 3. Inserts queue up in ReplicatedMergeTree queue

-- Check queue on surviving replica
SELECT * FROM system.replication_queue WHERE database = 'events';

-- Once ch1 recovers, it catches up automatically
-- Monitor the recovery:
SELECT database, table, absolute_delay
FROM system.replicas
WHERE database = 'events'
ORDER BY absolute_delay DESC;

-- If entire shard (ch1 + ch2) fails = data loss for that shard
-- Therefore: ensure geographically distributed replicas
✅ Distributed tables enable parallel queries across shards
✅ SSL/TLS secures inter-node and client communication
✅ Quotas and resource limits prevent runaway queries
✅ Monitor replication lag, disk usage, and query performance
✅ Plan for geographic distribution for disaster recovery
Ready for Module 6? Next, we'll dive deep into Query Optimization techniques!
🐳 Hands-on Docker Demo for this Module
A self-contained ClickHouse stack you can run locally. Every step is reproducible; the README below walks through each concept with diagrams and measured outcomes.
cd code-examples/demos/module-5-cluster-deploy
./up.sh        # bring stack up, wait for health
./run.sh       # run the demo (idempotent — re-runnable)
./down.sh      # tear down + drop volumes
📺 Live demo capture
Recorded with vhs: the actual terminal output from ./run.sh running on this very stack.
Animated GIF, ~716 KB. Right-click → open in new tab to view full-size.
🗂️ Architecture diagrams
Rendered from the README's Mermaid sources. Click any to open the source SVG full-size.
Subgraph app application tierActor op as operatorHot warm cold tiers and read path caches
📚 ClickHouse reference visuals
Curated from the official ClickHouse documentation and engineering blog (and Altinity's docs/blog) — the same diagrams the broader CH community uses to explain these concepts. Click any image to read the source.
ClickHouse Docs
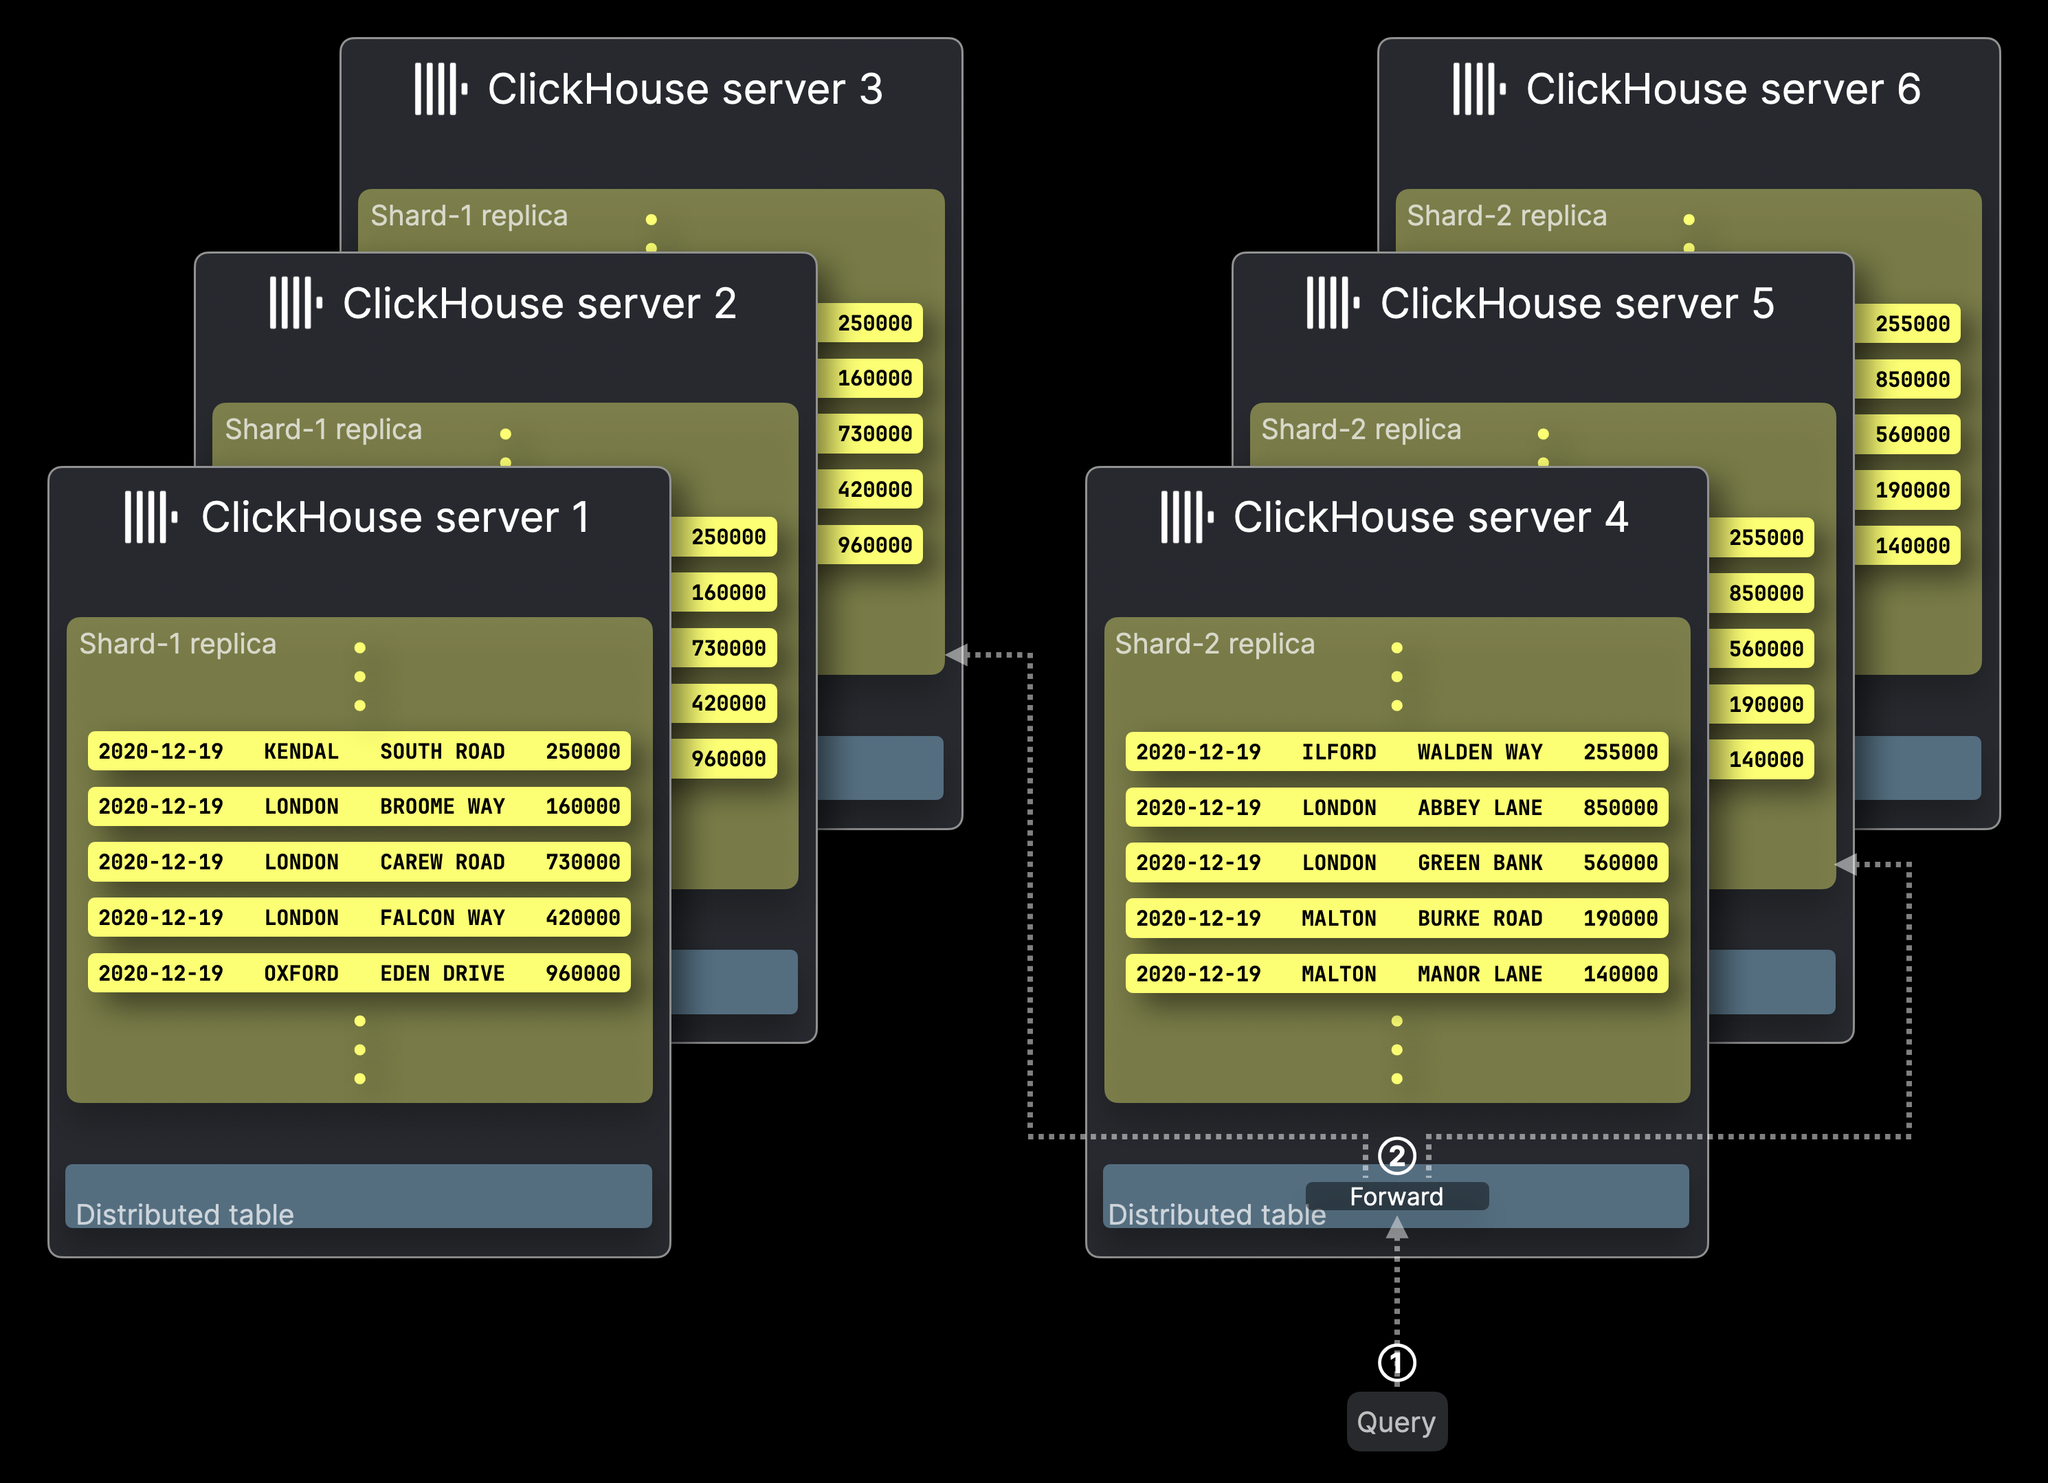
Sharded + replicated cluster (3 shards x 2 replicas) with Keeper
ClickHouse Docs
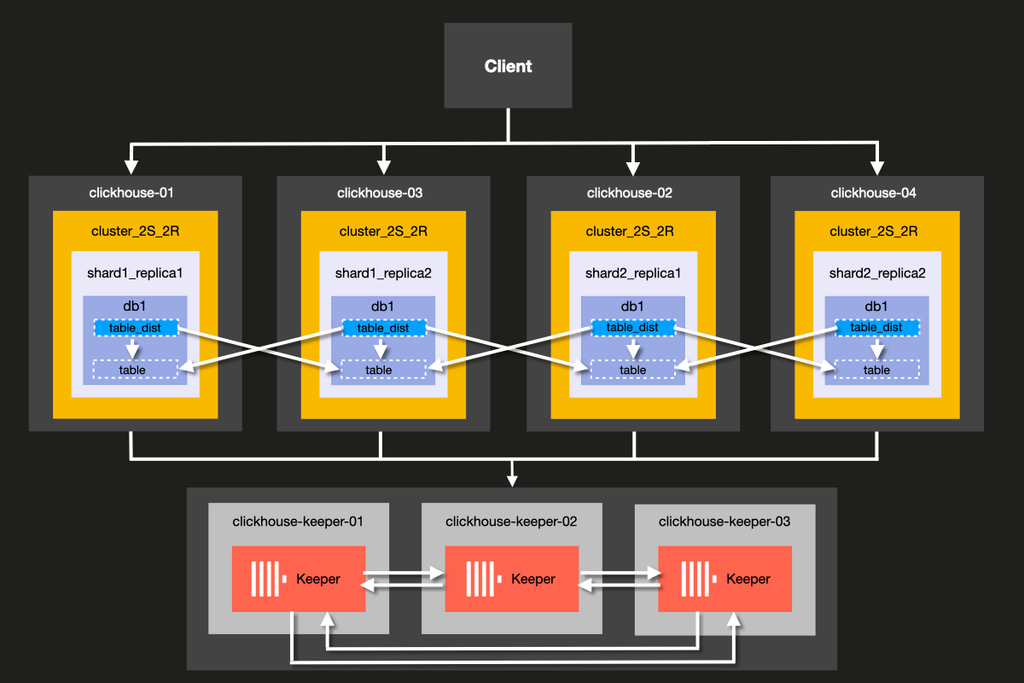
Combined sharding and replication architecture
ClickHouse Blog
Shared-nothing cluster: 3 shards x 2 replicas (typical layout)
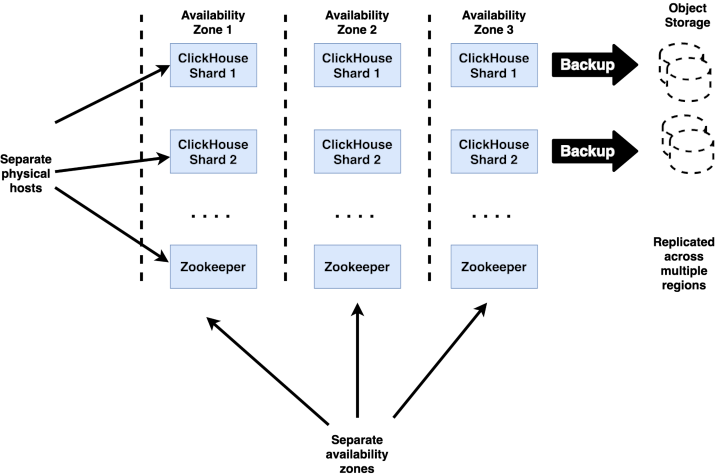
Altinity Docs
Production HA architecture with replicas and Keeper ensemble
📚 Full module reference
Module 5 — Cluster Deployment & Operations
Audience: anyone responsible for deploying / running CH clusters.
Prerequisites: Modules 1–4. Time: ~70 min reading + 30 min hands-on.
By the end you will be able to:
Drive a CH cluster as a single thing via ON CLUSTER DDL.
Audit cluster operations via system.distributed_ddl_queue.
Use cluster(), clusterAllReplicas(), remote() table functions for
ad-hoc cross-shard queries.
Configure users, profiles, quotas, and roles.
Enable the built-in Prometheus exporter.
Sketch a TLS-secured production deployment.
1. The "cluster as one thing" mental model
💬 Discuss with AI — click to view prompt
Paste into ChatGPT, Claude, Gemini, or any LLM chat.
I'm studying ClickHouse and working through the module "ClickHouse Cluster Deployment". I want to deeply understand the section: "The "cluster as one thing" mental model".

Here is a brief excerpt from the material I'm reading:

"""
A ClickHouse cluster is *not* a unified service like Kafka or Postgres streaming replication. It's **a set of independent CH processes that share a `<remote_servers>` definition and a ZK ensemble**. There is no "primary" or "controller". Every node knows the same cluster shape. Coordination boundaries: | Concern              | Coordinated via                | Stored in                            | | Replication queue    | ZooKeeper / Keeper             | `/clickhouse/tables/...`             | | ON CLUSTER DDL       | ZooKeeper / Keeper             | `/clickhouse/task_queue/ddl/...`     | | Sha...
"""

Please explain this concept in depth. Cover:

1. **Core mechanics** — how does it actually work under the hood? What data structures, algorithms, or engine internals are involved? Where is the implementation in the ClickHouse source tree (file/folder names) if you know?

2. **When to use vs avoid** — what concrete workloads does this help, and when would it hurt or be wrong? Give specific scale/latency trade-offs.

3. **Comparable features in other systems** — how does this compare with similar features in PostgreSQL, MySQL, BigQuery, Snowflake, Redshift, or DuckDB? Build my intuition by analogy.

4. **Common pitfalls and gotchas** — what trips engineers up in production? Subtle bugs, performance traps, surprising semantics?

5. **Worked example** — show me a small but realistic SQL or config example that demonstrates the concept end-to-end. Include the expected output where useful.

6. **Where to read more** — a short list of authoritative pointers (CH docs, blog posts, talks, source-code files).

Assume I have solid SQL fundamentals but I'm new to ClickHouse internals. Be technical but pragmatic; avoid marketing language.
A ClickHouse cluster is not a unified service like Kafka or Postgres
streaming replication. It's a set of independent CH processes that
share a <remote_servers> definition and a ZK ensemble. There is no
"primary" or "controller". Every node knows the same cluster shape.
Coordination boundaries:
Concern
Coordinated via
Stored in
Replication queue
ZooKeeper / Keeper
/clickhouse/tables/...
ON CLUSTER DDL
ZooKeeper / Keeper
/clickhouse/task_queue/ddl/...
Sharding metadata
static XML on each node
<remote_servers> in config
User / role data
static XML or SQL in users.d
per-node by default, or in ZK
2. ON CLUSTER — DDL fanout
💬 Discuss with AI — click to view prompt
Paste into ChatGPT, Claude, Gemini, or any LLM chat.
I'm studying ClickHouse and working through the module "ClickHouse Cluster Deployment". I want to deeply understand the section: "ON CLUSTER — DDL fanout".

Here is a brief excerpt from the material I'm reading:

"""
(no excerpt — section heading was "ON CLUSTER — DDL fanout")
"""

Please explain this concept in depth. Cover:

1. **Core mechanics** — how does it actually work under the hood? What data structures, algorithms, or engine internals are involved? Where is the implementation in the ClickHouse source tree (file/folder names) if you know?

2. **When to use vs avoid** — what concrete workloads does this help, and when would it hurt or be wrong? Give specific scale/latency trade-offs.

3. **Comparable features in other systems** — how does this compare with similar features in PostgreSQL, MySQL, BigQuery, Snowflake, Redshift, or DuckDB? Build my intuition by analogy.

4. **Common pitfalls and gotchas** — what trips engineers up in production? Subtle bugs, performance traps, surprising semantics?

5. **Worked example** — show me a small but realistic SQL or config example that demonstrates the concept end-to-end. Include the expected output where useful.

6. **Where to read more** — a short list of authoritative pointers (CH docs, blog posts, talks, source-code files).

Assume I have solid SQL fundamentals but I'm new to ClickHouse internals. Be technical but pragmatic; avoid marketing language.
CREATE TABLE analytics.page_views_local ON CLUSTER clickhouse_cluster (
    ts DateTime, user_id UInt64, page LowCardinality(String), ...
)
ENGINE = ReplicatedMergeTree(
    '/clickhouse/tables/{shard}/page_views_local',
    '{replica}'
)
ORDER BY (page, user_id, ts);
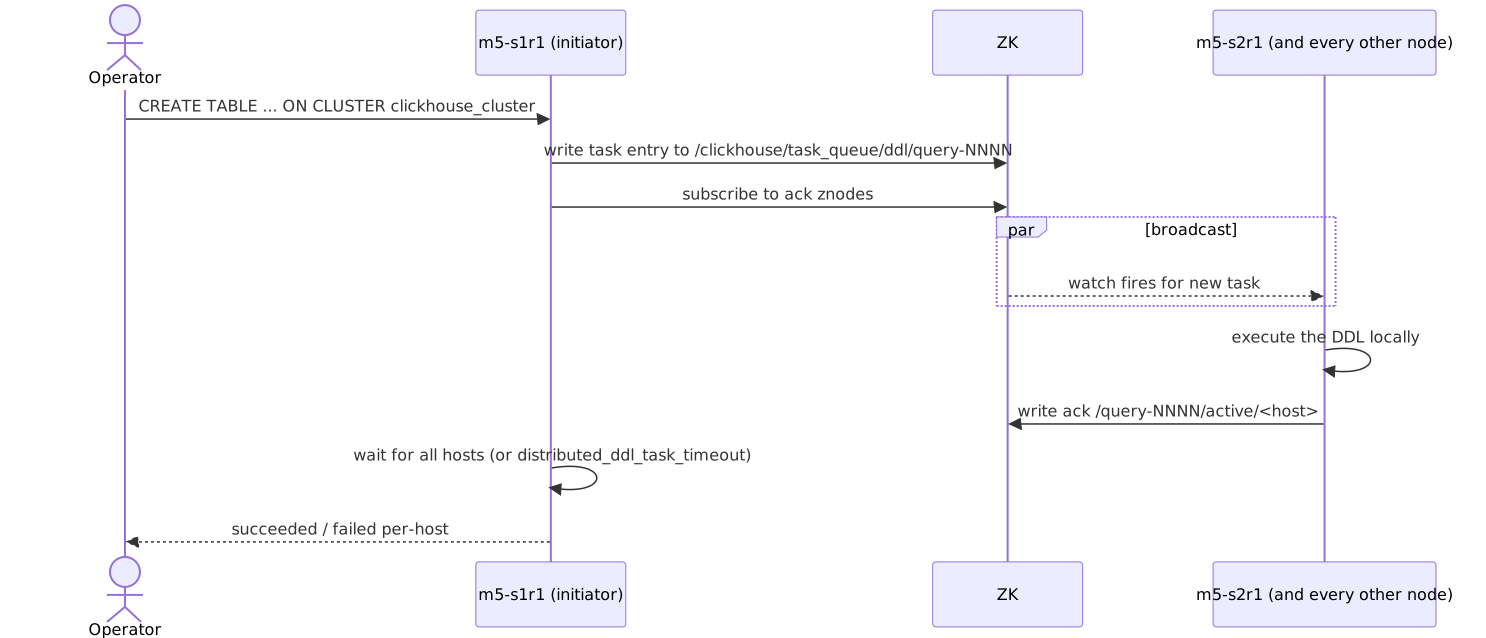
What happens when you run that:
The audit trail lives in system.distributed_ddl_queue:
SELECT entry, host_name, port, status, exception_text, query_create_time
FROM system.distributed_ddl_queue
ORDER BY query_create_time DESC LIMIT 10;
Tuning:distributed_ddl_task_timeout (default 180 s) bounds the
wait. For big clusters bump it; for CI it can be tighter.
3. The cluster-aware table functions
💬 Discuss with AI — click to view prompt
Paste into ChatGPT, Claude, Gemini, or any LLM chat.
I'm studying ClickHouse and working through the module "ClickHouse Cluster Deployment". I want to deeply understand the section: "The cluster-aware table functions".

Here is a brief excerpt from the material I'm reading:

"""
You don't always want a Distributed table. For one-shot queries, use: | Function                              | Hits                            | Use for                                   | | `cluster('cluster_name', db, tbl)`    | one replica per shard           | one-off fan-out aggregation                | | `clusterAllReplicas('...', db, tbl)`  | every replica of every shard     | replica-equivalence checks (NOT aggregations) | | `remote('host:port', db, tbl)`        | one specific host                | cross-cluster spot reads                   | | `remoteSecure('host:port', db, tbl)`  |...
"""

Please explain this concept in depth. Cover:

1. **Core mechanics** — how does it actually work under the hood? What data structures, algorithms, or engine internals are involved? Where is the implementation in the ClickHouse source tree (file/folder names) if you know?

2. **When to use vs avoid** — what concrete workloads does this help, and when would it hurt or be wrong? Give specific scale/latency trade-offs.

3. **Comparable features in other systems** — how does this compare with similar features in PostgreSQL, MySQL, BigQuery, Snowflake, Redshift, or DuckDB? Build my intuition by analogy.

4. **Common pitfalls and gotchas** — what trips engineers up in production? Subtle bugs, performance traps, surprising semantics?

5. **Worked example** — show me a small but realistic SQL or config example that demonstrates the concept end-to-end. Include the expected output where useful.

6. **Where to read more** — a short list of authoritative pointers (CH docs, blog posts, talks, source-code files).

Assume I have solid SQL fundamentals but I'm new to ClickHouse internals. Be technical but pragmatic; avoid marketing language.
You don't always want a Distributed table. For one-shot queries, use:
Function
Hits
Use for
cluster('cluster_name', db, tbl)
one replica per shard
one-off fan-out aggregation
clusterAllReplicas('...', db, tbl)
every replica of every shard
replica-equivalence checks (NOT aggregations)
remote('host:port', db, tbl)
one specific host
cross-cluster spot reads
remoteSecure('host:port', db, tbl)
same, over TLS
production cross-cluster
-- Quick "what's on each shard?" without creating a Distributed table:
SELECT shardNum() AS shard, count()
FROM cluster('clickhouse_cluster', analytics, page_views_local)
GROUP BY shard;

-- Replica-equivalence check (don't aggregate raw data over this):
SELECT hostName(), count()
FROM clusterAllReplicas('clickhouse_cluster', analytics, page_views_local)
GROUP BY hostName();

-- Pin to one specific host for diagnosis:
SELECT count() FROM remote('m5-s2r1:9000', analytics, page_views_local);
4. Users, profiles, quotas, roles
💬 Discuss with AI — click to view prompt
Paste into ChatGPT, Claude, Gemini, or any LLM chat.
I'm studying ClickHouse and working through the module "ClickHouse Cluster Deployment". I want to deeply understand the section: "Users, profiles, quotas, roles".

Here is a brief excerpt from the material I'm reading:

"""
XML defines users; SQL defines roles and grants. Both live for the lifetime of the server; for dynamic auth, use the SQL form. ### Anatomy of `users.xml` ### SQL roles + grants Once users exist, grants are the SQL way: Inspect: > **Production tip:** keep `<users>` in XML for the *bootstrap* user > (`admin`); manage everything else via SQL `CREATE USER … GRANT …`. SQL > users go into ZK if `<user_directories>` includes > `<replicated><zookeeper_path>...`.
"""

Please explain this concept in depth. Cover:

1. **Core mechanics** — how does it actually work under the hood? What data structures, algorithms, or engine internals are involved? Where is the implementation in the ClickHouse source tree (file/folder names) if you know?

2. **When to use vs avoid** — what concrete workloads does this help, and when would it hurt or be wrong? Give specific scale/latency trade-offs.

3. **Comparable features in other systems** — how does this compare with similar features in PostgreSQL, MySQL, BigQuery, Snowflake, Redshift, or DuckDB? Build my intuition by analogy.

4. **Common pitfalls and gotchas** — what trips engineers up in production? Subtle bugs, performance traps, surprising semantics?

5. **Worked example** — show me a small but realistic SQL or config example that demonstrates the concept end-to-end. Include the expected output where useful.

6. **Where to read more** — a short list of authoritative pointers (CH docs, blog posts, talks, source-code files).

Assume I have solid SQL fundamentals but I'm new to ClickHouse internals. Be technical but pragmatic; avoid marketing language.
XML defines users; SQL defines roles and grants. Both live for the
lifetime of the server; for dynamic auth, use the SQL form.
CREATE ROLE reader      ON CLUSTER clickhouse_cluster;
CREATE ROLE writer      ON CLUSTER clickhouse_cluster;

GRANT SELECT ON analytics.*                       TO reader  ON CLUSTER clickhouse_cluster;
GRANT INSERT ON analytics.page_views_distributed   TO writer  ON CLUSTER clickhouse_cluster;

GRANT reader TO analyst ON CLUSTER clickhouse_cluster;
GRANT writer TO app     ON CLUSTER clickhouse_cluster;
Inspect:
SELECT name, storage FROM system.users  ORDER BY name;
SELECT name, storage FROM system.roles  ORDER BY name;
SELECT user_name, role_name, granted_role_is_default
FROM system.role_grants ORDER BY user_name;
SELECT * FROM system.quotas_usage WHERE name = 'analyst_quota';
Production tip: keep <users> in XML for the bootstrap user
(admin); manage everything else via SQL CREATE USER … GRANT …. SQL
users go into ZK if <user_directories> includes
<replicated><zookeeper_path>....
5. The Prometheus endpoint
💬 Discuss with AI — click to view prompt
Paste into ChatGPT, Claude, Gemini, or any LLM chat.
I'm studying ClickHouse and working through the module "ClickHouse Cluster Deployment". I want to deeply understand the section: "The Prometheus endpoint".

Here is a brief excerpt from the material I'm reading:

"""
CH ships a built-in exporter. Two lines of config: What it exposes: | Metric kind                | Examples                                                     | | Cumulative events          | `ClickHouseProfileEvents_Query`, `ClickHouseProfileEvents_InsertedRows` | | Current values (gauges)    | `ClickHouseMetrics_Query`, `ClickHouseMetrics_PartsActive`   | | Async metrics              | `ClickHouseAsyncMetrics_jemalloc_resident`, `..._FilesystemMainPath_AvailableINodes` | | Status (custom)            | `ClickHouseStatusInfo_DictionaryStatus`                      | Smoke test: A minimal Prome...
"""

Please explain this concept in depth. Cover:

1. **Core mechanics** — how does it actually work under the hood? What data structures, algorithms, or engine internals are involved? Where is the implementation in the ClickHouse source tree (file/folder names) if you know?

2. **When to use vs avoid** — what concrete workloads does this help, and when would it hurt or be wrong? Give specific scale/latency trade-offs.

3. **Comparable features in other systems** — how does this compare with similar features in PostgreSQL, MySQL, BigQuery, Snowflake, Redshift, or DuckDB? Build my intuition by analogy.

4. **Common pitfalls and gotchas** — what trips engineers up in production? Subtle bugs, performance traps, surprising semantics?

5. **Worked example** — show me a small but realistic SQL or config example that demonstrates the concept end-to-end. Include the expected output where useful.

6. **Where to read more** — a short list of authoritative pointers (CH docs, blog posts, talks, source-code files).

Assume I have solid SQL fundamentals but I'm new to ClickHouse internals. Be technical but pragmatic; avoid marketing language.
CH ships a built-in exporter. Two lines of config:
Grafana has a community dashboard (ID 14192) tuned to these metrics.
6. TLS — securing the cluster
💬 Discuss with AI — click to view prompt
Paste into ChatGPT, Claude, Gemini, or any LLM chat.
I'm studying ClickHouse and working through the module "ClickHouse Cluster Deployment". I want to deeply understand the section: "TLS — securing the cluster".

Here is a brief excerpt from the material I'm reading:

"""
The demo doesn't ship certs (kept out of source control), but here's the production sketch: Generate dev certs with `mkcert` (one-liner) or `step-ca`. Production should use real certs from your PKI, with mTLS for inter-server traffic. Connect with TLS:
"""

Please explain this concept in depth. Cover:

1. **Core mechanics** — how does it actually work under the hood? What data structures, algorithms, or engine internals are involved? Where is the implementation in the ClickHouse source tree (file/folder names) if you know?

2. **When to use vs avoid** — what concrete workloads does this help, and when would it hurt or be wrong? Give specific scale/latency trade-offs.

3. **Comparable features in other systems** — how does this compare with similar features in PostgreSQL, MySQL, BigQuery, Snowflake, Redshift, or DuckDB? Build my intuition by analogy.

4. **Common pitfalls and gotchas** — what trips engineers up in production? Subtle bugs, performance traps, surprising semantics?

5. **Worked example** — show me a small but realistic SQL or config example that demonstrates the concept end-to-end. Include the expected output where useful.

6. **Where to read more** — a short list of authoritative pointers (CH docs, blog posts, talks, source-code files).

Assume I have solid SQL fundamentals but I'm new to ClickHouse internals. Be technical but pragmatic; avoid marketing language.
The demo doesn't ship certs (kept out of source control), but here's the
production sketch:
7. Hot / warm / cold storage tiers — production sizing
💬 Discuss with AI — click to view prompt
Paste into ChatGPT, Claude, Gemini, or any LLM chat.
I'm studying ClickHouse and working through the module "ClickHouse Cluster Deployment". I want to deeply understand the section: "Hot / warm / cold storage tiers — production sizing".

Here is a brief excerpt from the material I'm reading:

"""
The demo runs every node on a single local disk (kept simple so it boots on a laptop), so — exactly like the TLS section — this is the **production sketch** you layer on top. A real cluster almost never keeps a year of data on the same NVMe it ingests onto: it tiers. ### The mental model: disks → volumes → policy ClickHouse never moves data by table or by row — it moves **parts**, and it moves them down an ordered list of volumes. Four nested objects: | Object           | What it is                                                            | | **disk**         | one physical/logical location:...
"""

Please explain this concept in depth. Cover:

1. **Core mechanics** — how does it actually work under the hood? What data structures, algorithms, or engine internals are involved? Where is the implementation in the ClickHouse source tree (file/folder names) if you know?

2. **When to use vs avoid** — what concrete workloads does this help, and when would it hurt or be wrong? Give specific scale/latency trade-offs.

3. **Comparable features in other systems** — how does this compare with similar features in PostgreSQL, MySQL, BigQuery, Snowflake, Redshift, or DuckDB? Build my intuition by analogy.

4. **Common pitfalls and gotchas** — what trips engineers up in production? Subtle bugs, performance traps, surprising semantics?

5. **Worked example** — show me a small but realistic SQL or config example that demonstrates the concept end-to-end. Include the expected output where useful.

6. **Where to read more** — a short list of authoritative pointers (CH docs, blog posts, talks, source-code files).

Assume I have solid SQL fundamentals but I'm new to ClickHouse internals. Be technical but pragmatic; avoid marketing language.
The demo runs every node on a single local disk (kept simple so it boots on
a laptop), so — exactly like the TLS section — this is the production
sketch you layer on top. A real cluster almost never keeps a year of data
on the same NVMe it ingests onto: it tiers.
The mental model: disks → volumes → policy
ClickHouse never moves data by table or by row — it moves parts, and it
moves them down an ordered list of volumes. Four nested objects:
Object
What it is
disk
one physical/logical location: local NVMe, local HDD, or S3/GCS/Azure
volume
an ordered group of one or more disks
storage policy
an ordered list of volumes; parts flow first → last
TTL … TO
the rule that moves a part to a later volume once it ages
Why parts, not rows: a part is the immutable unit of MergeTree storage.
Moving it is a file copy — no rewrite, no re-sort. That's why TTL moves are
cheap relative to, say, a Postgres partition migration.
Wiring it up (config + DDL)
config.d/storage.xml defines the disks and the policy:
<clickhouse>
  <storage_configuration>
    <disks>
      <hot>  <type>local</type> <path>/mnt/nvme/clickhouse/</path> </hot>
      <warm> <type>local</type> <path>/mnt/hdd/clickhouse/</path>  </warm>
      <cold>
        <type>s3</type>
        <endpoint>https://s3.amazonaws.com/my-bucket/clickhouse/</endpoint>
        <access_key_id>...</access_key_id>
        <secret_access_key>...</secret_access_key>
        <!-- S3 transport tuning (see the "S3 transport settings" table below) -->
        <s3_max_connections>1024</s3_max_connections>
        <min_bytes_for_seek>1048576</min_bytes_for_seek>   <!-- 1 MiB: below this, read through instead of a new ranged GET -->
        <s3_max_get_rps>5000</s3_max_get_rps>              <!-- client-side rate limit; dodges S3 503 SlowDown -->
      </cold>
      <!-- local-NVMe read-through cache in FRONT of S3: first read pulls a
           segment from S3 to disk, every later read is local. THIS is what
           makes a cold tier query-able instead of merely cheap. -->
      <cold_cached>
        <type>cache</type>
        <disk>cold</disk>
        <path>/mnt/nvme/s3_cache/</path>
        <max_size>200Gi</max_size>                          <!-- NVMe you hand to caching cold data -->
        <max_file_segment_size>8Mi</max_file_segment_size>  <!-- cache granularity -->
        <cache_on_write_operations>true</cache_on_write_operations>  <!-- moved-in parts land already-warm -->
        <cache_hits_threshold>2</cache_hits_threshold>      <!-- don't cache a one-off scan -->
        <load_metadata_threads>16</load_metadata_threads>
      </cold_cached>
    </disks>

    <policies>
      <hot_warm_cold>
        <volumes>
          <hot>
            <disk>hot</disk>
            <max_data_part_size_bytes>10737418240</max_data_part_size_bytes>
          </hot>
          <warm>
            <disk>warm</disk>
          </warm>
          <cold>
            <disk>cold_cached</disk>
            <prefer_not_to_merge>true</prefer_not_to_merge>
          </cold>
        </volumes>
        <move_factor>0.2</move_factor>
      </hot_warm_cold>
    </policies>
  </storage_configuration>
</clickhouse>
The table opts in via storage_policy, and TTL drives the moves:
CREATE TABLE analytics.events_local ON CLUSTER clickhouse_cluster (
    event_time DateTime,
    user_id    UInt64,
    payload    String CODEC(ZSTD(3))      -- heavier codec pays off on cold
)
ENGINE = ReplicatedMergeTree('/clickhouse/tables/{shard}/events_local', '{replica}')
ORDER BY (user_id, event_time)
TTL event_time + INTERVAL 7   DAY TO VOLUME 'warm',
    event_time + INTERVAL 30  DAY TO VOLUME 'cold',
    event_time + INTERVAL 365 DAY DELETE
SETTINGS storage_policy = 'hot_warm_cold';
Watch parts move:
SELECT disk_name, count() AS parts, formatReadableSize(sum(bytes_on_disk)) AS size
FROM system.parts
WHERE table = 'events_local' AND active
GROUP BY disk_name ORDER BY disk_name;

-- force a move for a demo instead of waiting for TTL:
ALTER TABLE analytics.events_local MOVE PART 'all_1_1_0' TO VOLUME 'cold';
The performance parameters that matter (and why)
Parameter
Scope
Default
Why you set it for tiering
move_factor
policy
0.1
When free space on a volume drops below this fraction, CH proactively pushes the oldest parts down a tier before TTL fires. Bump to 0.2 so the hot NVMe always keeps headroom for inserts + merges; if hot fills to 100% inserts stall.
max_data_part_size_bytes
volume
unlimited
Caps the part size allowed on a volume. Keep big merged parts off the small/expensive hot tier so they land on warm/cold automatically.
prefer_not_to_merge
volume
false
Set true on the cold (S3) volume. Merges re-read + re-write whole parts; on object storage that's massive egress + request cost + latency for no query benefit.
perform_ttl_move_on_insert
MergeTree setting
1
Set 0 under heavy ingest so a freshly-inserted-but-already-old part isn't moved synchronously on the insert path (which slows inserts). Let the background mover handle it.
background_move_pool_size
server
8
Threads dedicated to TTL/move work. Raise on clusters that tier large volumes so moves keep up with ingest.
allow_remote_fs_zero_copy_replication
server / MergeTree
false*
Critical on S3 cold tiers. Without it, every replica uploads its own copy of cold parts to object storage → N× storage + N× egress. With it, replicas share one set of S3 objects and only replicate metadata. Has known edge cases — pin a CH version you've tested.
min_bytes_for_seek
s3 disk
1Mi
Below this, CH reads a whole granule range rather than issuing a tiny ranged GET. Tunes S3 request count vs bytes transferred.
codec per column
DDL
LZ4
Use fast LZ4 for hot-path columns, heavier ZSTD(3+) for columns that spend their life on cold — you trade CPU on the rare cold read for far less storage + egress.
Rule of thumb for the move schedule: size the hot TTL window so the
hot volume holds (ingest_rate × window × replication_factor) + ~30 %
merge headroom, and keep move_factor headroom on top. The 30 % is not
optional — a merge transiently needs room for both inputs and output.
Caches — the layer that makes a cold tier query-able
Tiering is only half the story. Cheap cold storage is useless if every query
that touches it pays a network round-trip per granule. ClickHouse has two
cache layers — in RAM and on local disk — and tuning them is what
turns "cold = cheap but unusable" into "cold = cheap and fine".
1. RAM caches (server-level settings in config.xml):
Setting
Default
What it holds & why it matters more when tiered
mark_cache_size
5368709120 (5 GiB)
Caches the decompressed .mrkmarks — the map from granule number → byte offset inside each compressed column file. Every column read consults marks first; a mark miss on a cold part is a synchronous S3 GET before the real read even starts. This is the single highest-leverage cache on a tiered cluster — raise it to 10–20 % of RAM. Watch ProfileEventsMarkCacheHits/MarkCacheMisses and AsynchronousMetricsMarkCacheBytes/MarkCacheFiles.
primary_index_cache_size
5368709120 (5 GiB, CH 24.x+)
Lazily caches primary-key index granules instead of forcing every active part's full PK index permanently resident. This is the modern fix for the "thousands of cold parts ⇒ unbounded PK RAM" problem described below — on older versions there is no cap and the whole PK index of every part stays in memory. Size it to your hot+warm working set of parts.
uncompressed_cache_size
8 GiB, but off (use_uncompressed_cache=0)
Caches decompressed data blocks. A win for high-QPS point lookups that re-hit the same blocks; pure waste for big scans (it just churns). Leave off globally, enable per-query/profile where the access pattern is repetitive point reads.
Same idea, for secondary (skip) indexes. Bump only if you lean on skip indexes over cold data.
2. Filesystem cache for the object-store tier (the cache disk above):
The cache-type disk is a local-NVMe read-through cache that sits in front
of S3. First read of a cold segment fetches it from S3 onto local disk;
every subsequent read is a local read at NVMe latency. Sizing and behaviour:
Setting (on the cache disk)
Guidance
max_size
The headline number: how much NVMe you allocate to cache cold data. Size it to your hot subset of cold — the slice of historical data users actually re-query (e.g. last quarter of a 1-year cold tier), not the whole tier. It competes with the hot volume for the same NVMe, so budget them together.
cache_on_write_operations
true so parts are cached as they're moved/written into cold, so freshly-tiered data is immediately warm instead of cold-cold on its first read.
max_file_segment_size
Segment granularity (default 8 MiB). Smaller = finer eviction but more metadata; the default is usually right.
cache_hits_threshold
Require N accesses before a segment is admitted, so a single ad-hoc full-history scan can't evict the genuinely-hot working set.
load_metadata_threads
Parallelism for loading cache metadata on startup — raise for large caches so restarts aren't slow.
Query-level knobs that pair with it: enable_filesystem_cache (default 1);
read_from_filesystem_cache_if_exists_otherwise_bypass_cache=1 for one-off
backfills/exports so they read cache but don't pollute it;
filesystem_cache_max_download_size to bound a single query's footprint.
Observe hit ratio via system.filesystem_cache, AsynchronousMetricsFilesystemCacheSize/FilesystemCacheFiles, and the ProfileEvents pair
CachedReadBufferReadFromCacheBytes vs CachedReadBufferReadFromSourceBytes.
3. S3 transport settings (request count, throughput, cost):
Setting
Default
Why you touch it
s3_max_connections
1024
Concurrent connections per S3 disk. Raise for highly-parallel cold scans; lower to cap pressure on a shared bucket.
min_bytes_for_seek
1Mi
Below this gap, CH reads straight through rather than issuing a new ranged GET. Each GET is latency and a billed request — raising this trades bytes transferred for fewer requests.
s3_max_get_rps / s3_max_put_rps
0 (unlimited)
Client-side rate limits. Set them to stay under S3's per-prefix limits and dodge 503 SlowDown, and to put a ceiling on request-cost spikes.
Multipart-upload sizing for the move-out path (writing parts to cold). Larger parts ⇒ fewer PUTs.
remote_filesystem_read_method
threadpool
Keep as threadpool so ranged reads parallelise instead of serialising.
s3_retry_attempts / s3_request_timeout_ms
10 / 30000
Resilience against transient S3 errors; tune for your provider's tail latency.
RAM & CPU limits — what actually constrains a tiered cluster
Tiering shifts where bytes live, but the bottlenecks move with them.
RAM
Primary-key index RAM scales with part count. The cold tier with
prefer_not_to_merge=true deliberately accumulates many small parts. On
older CH the full sparse PK index of every active part stays permanently
resident → lots of cold parts ⇒ real RAM pressure (and slower SELECTs,
since there are more parts to merge at query time). On CH 24.x+,
primary_index_cache_size (see the caches section) bounds this — but you
still want to watch system.parts count, the root cause.
mark_cache_size is the highest-leverage cache when tiered (default
5 GiB). A mark miss on a cold part is a synchronous S3 GET before the
real read. Raise it to 10–20 % of RAM and watch MarkCacheMisses — size
this before you size anything else. (Full detail in the caches section.)
OS page cache only helps the hot/warm local tiers. Cold (S3) reads
get no free page-cache reuse, so the local-NVMe filesystem cache (the
cold_cached disk above) is how you claw back locality — but its max_size
is NVMe you must budget against the hot volume on the same disk.
Queries that span hot + cold scan more total data, so per-query
max_memory_usage for aggregations/sorts must cover the widest time
range users actually query, not just the hot window.
CPU
Decompression dominates cold reads. A cold part is fetched, then
decompressed on every read with no page-cache shortcut — and if you chose
ZSTD to save space, that's deliberately more CPU per byte. Size cores
for the number of concurrent cold-scanning queries you allow.
Merges and TTL moves are CPU + IO heavy.prefer_not_to_merge on cold
is as much a CPU saver as a cost saver. Moves copy + checksum parts;
schedule wide TTL windows away from query peaks.
Don't starve the background pools. Moves, merges, and fetches share
CPU with queries. On an undersized box, aggressive tiering can make the
hot path slower because the mover and merger are competing for cores.
The trap in one sentence: tiering trades expensive-but-fast NVMe for
cheap-but-distant S3 — and you pay that trade back in RAM (more parts =
more resident PK indexes) and CPU (every cold read decompresses from
scratch). Budget both, or the cost win turns into a latency loss.
Gotchas
Symptom
Cause
Fix
Inserts stall / "Cannot reserve space"
Hot volume filled before moves caught up.
Raise move_factor; raise background_move_pool_size; shorten hot TTL window.
First query on old data is seconds slow
Cold part fetched from S3 with no local cache.
Add a cache-type disk in front of S3; pre-warm with a scheduled query.
Cold queries stay slow after a warm-up read
Filesystem cache too small, or a big ad-hoc scan evicted the working set.
Raise the cache disk max_size; set cache_hits_threshold; run pollution-prone backfills with read_from_filesystem_cache_if_exists_otherwise_bypass_cache=1.
Point queries on cold are slow but scans are fine
mark_cache_size too small — each query re-fetches marks from S3.
Raise mark_cache_size to 10–20 % of RAM; check MarkCacheMisses.
S3 503 SlowDown / throttling under load
Too many small ranged GETs against one bucket prefix.
Set s3_max_get_rps; raise min_bytes_for_seek; make sure the filesystem cache is actually hitting.
"Too many parts" on the cold tier
prefer_not_to_merge + long retention = thousands of small parts.
Merge before the move (bigger parts cross the tier boundary), or accept the RAM cost knowingly.
S3 bill 3× expected
No zero-copy replication — every replica uploaded its own copy.
Enable allow_remote_fs_zero_copy_replication (on a version you've tested).
TTL move never happens
perform_ttl_move_on_insert=0 and the background merge that evaluates TTL hasn't run.
ALTER TABLE … MOVE PARTITION …, or check system.part_log / background_move_pool_size.
8. The hands-on demo
💬 Discuss with AI — click to view prompt
Paste into ChatGPT, Claude, Gemini, or any LLM chat.
I'm studying ClickHouse and working through the module "ClickHouse Cluster Deployment". I want to deeply understand the section: "The hands-on demo".

Here is a brief excerpt from the material I'm reading:

"""
### What you get ### Container map Same shape as M3/M4 with the `m5-` prefix; ports `8123-8128` HTTP, `9000-9005` TCP. ### Execution flow — what runs, in order | #  | Step                                       | What happens                                                                                                                                                                                                           | | 0  | self-bootstrap                             | `up.sh` brings up the cluster (9 containers) and tears down peer demo modules. `users.xml`, `prometheus.xml`, and the c...
"""

Please explain this concept in depth. Cover:

1. **Core mechanics** — how does it actually work under the hood? What data structures, algorithms, or engine internals are involved? Where is the implementation in the ClickHouse source tree (file/folder names) if you know?

2. **When to use vs avoid** — what concrete workloads does this help, and when would it hurt or be wrong? Give specific scale/latency trade-offs.

3. **Comparable features in other systems** — how does this compare with similar features in PostgreSQL, MySQL, BigQuery, Snowflake, Redshift, or DuckDB? Build my intuition by analogy.

4. **Common pitfalls and gotchas** — what trips engineers up in production? Subtle bugs, performance traps, surprising semantics?

5. **Worked example** — show me a small but realistic SQL or config example that demonstrates the concept end-to-end. Include the expected output where useful.

6. **Where to read more** — a short list of authoritative pointers (CH docs, blog posts, talks, source-code files).

Assume I have solid SQL fundamentals but I'm new to ClickHouse internals. Be technical but pragmatic; avoid marketing language.
Same shape as M3/M4 with the m5- prefix; ports 8123-8128 HTTP, 9000-9005 TCP.
Execution flow — what runs, in order
#
Step
What happens
0
self-bootstrap
up.sh brings up the cluster (9 containers) and tears down peer demo modules. users.xml, prometheus.xml, and the cluster + macros XMLs are bind-mounted into each CH node at startup.
1
setup.sql (via m5-s1r1)
ON CLUSTER creates database analytics, table analytics.page_views_local (ReplicatedMergeTree), and Distributed wrapper analytics.page_views_distributed. Every replica gets all three.
2
data.sql (via m5-s1r1)
Inserts 3M rows via the Distributed table.
3
SYSTEM FLUSH DISTRIBUTED × 6
Drains the Distributed spool on every node so the next reads are exact.
Layers SQL-managed access on top of users.xml: creates roles reader and writerON CLUSTER, grants reader to analyst and writer to app. Inspects system.users, system.roles, system.role_grants, system.grants, system.quotas_usage. Prints Prometheus + TLS notes.
6
Prometheus endpoint smoke test (in run.sh)
docker exec m5-s1r1 wget -qO- http://localhost:9363/metrics — first 5 lines should be Prometheus-formatted metrics. Confirms the <prometheus> block from 02-prometheus.xml is active.
What to look for
Step
What you should see
system.distributed_ddl_queue
One row per ON CLUSTER DDL × every host = 6 rows for each CREATE.
cluster() aggregation
One pass, results from every shard.
clusterAllReplicas()
Two rows per shard (one per replica).
system.users
default, admin, analyst, app — all from users.xml.
Role grants
reader → analyst, writer → app.
Prometheus smoke test
Lines like # HELP ClickHouseProfileEvents_Query ....
9. Operational SQL cheatsheet
💬 Discuss with AI — click to view prompt
Paste into ChatGPT, Claude, Gemini, or any LLM chat.
I'm studying ClickHouse and working through the module "ClickHouse Cluster Deployment". I want to deeply understand the section: "Operational SQL cheatsheet".

Here is a brief excerpt from the material I'm reading:

"""
(no excerpt — section heading was "Operational SQL cheatsheet")
"""

Please explain this concept in depth. Cover:

1. **Core mechanics** — how does it actually work under the hood? What data structures, algorithms, or engine internals are involved? Where is the implementation in the ClickHouse source tree (file/folder names) if you know?

2. **When to use vs avoid** — what concrete workloads does this help, and when would it hurt or be wrong? Give specific scale/latency trade-offs.

3. **Comparable features in other systems** — how does this compare with similar features in PostgreSQL, MySQL, BigQuery, Snowflake, Redshift, or DuckDB? Build my intuition by analogy.

4. **Common pitfalls and gotchas** — what trips engineers up in production? Subtle bugs, performance traps, surprising semantics?

5. **Worked example** — show me a small but realistic SQL or config example that demonstrates the concept end-to-end. Include the expected output where useful.

6. **Where to read more** — a short list of authoritative pointers (CH docs, blog posts, talks, source-code files).

Assume I have solid SQL fundamentals but I'm new to ClickHouse internals. Be technical but pragmatic; avoid marketing language.
-- "Show me the cluster"
SELECT cluster, shard_num, replica_num, host_name, host_address, port,
       errors_count, slowdowns_count
FROM system.clusters WHERE cluster = 'clickhouse_cluster'
ORDER BY shard_num, replica_num;

-- "Show me everyone who can do anything"
SELECT user_name, role_name, access_type, database, table
FROM system.grants ORDER BY user_name, database;

-- "Did the last DDL succeed everywhere?"
SELECT host_name, status, exception_text
FROM system.distributed_ddl_queue
WHERE entry = 'query-0000000023';

-- "Quota usage right now"
SELECT name, queries, errors, read_rows, execution_time
FROM system.quotas_usage WHERE name != 'default';

-- "Recent slow queries cluster-wide"
SELECT hostName() AS host, query_duration_ms, query
FROM clusterAllReplicas('clickhouse_cluster', system, query_log)
WHERE event_time > now() - INTERVAL 1 HOUR
  AND type = 'QueryFinish'
ORDER BY query_duration_ms DESC LIMIT 20;
10. Settings worth knowing
💬 Discuss with AI — click to view prompt
Paste into ChatGPT, Claude, Gemini, or any LLM chat.
I'm studying ClickHouse and working through the module "ClickHouse Cluster Deployment". I want to deeply understand the section: "Settings worth knowing".

Here is a brief excerpt from the material I'm reading:

"""
| Setting                              | Default | What it controls                                                          | | `distributed_ddl_task_timeout`       | 180     | Seconds the initiator waits for every node to ack an ON CLUSTER DDL.      | | `distributed_ddl_entry_format_version` | latest | Compat shim during version upgrades.                                      | | `distributed_product_mode`           | `'deny'` | How `IN`/`JOIN` between two Distributed tables expands. `'global'` rewrites to GLOBAL IN. | | `prefer_localhost_replica`           | 1       | When the query runs, pr...
"""

Please explain this concept in depth. Cover:

1. **Core mechanics** — how does it actually work under the hood? What data structures, algorithms, or engine internals are involved? Where is the implementation in the ClickHouse source tree (file/folder names) if you know?

2. **When to use vs avoid** — what concrete workloads does this help, and when would it hurt or be wrong? Give specific scale/latency trade-offs.

3. **Comparable features in other systems** — how does this compare with similar features in PostgreSQL, MySQL, BigQuery, Snowflake, Redshift, or DuckDB? Build my intuition by analogy.

4. **Common pitfalls and gotchas** — what trips engineers up in production? Subtle bugs, performance traps, surprising semantics?

5. **Worked example** — show me a small but realistic SQL or config example that demonstrates the concept end-to-end. Include the expected output where useful.

6. **Where to read more** — a short list of authoritative pointers (CH docs, blog posts, talks, source-code files).

Assume I have solid SQL fundamentals but I'm new to ClickHouse internals. Be technical but pragmatic; avoid marketing language.
Setting
Default
What it controls
distributed_ddl_task_timeout
180
Seconds the initiator waits for every node to ack an ON CLUSTER DDL.
distributed_ddl_entry_format_version
latest
Compat shim during version upgrades.
distributed_product_mode
'deny'
How IN/JOIN between two Distributed tables expands. 'global' rewrites to GLOBAL IN.
prefer_localhost_replica
1
When the query runs, prefer the same-host replica over a remote one.
Paste into ChatGPT, Claude, Gemini, or any LLM chat.
I'm studying ClickHouse and working through the module "ClickHouse Cluster Deployment". I want to deeply understand the section: "Common pitfalls".

Here is a brief excerpt from the material I'm reading:

"""
| Symptom                                                                       | Cause                                                                                  | Fix                                                                                                | | `ON CLUSTER` DDL hangs                                                        | One host unreachable; `distributed_ddl_task_timeout` exceeded.                          | `system.distributed_ddl_queue.exception_text` shows which host; fix it; rerun.                     | | `Code: 359. Table is already exists` after recreate-w...
"""

Please explain this concept in depth. Cover:

1. **Core mechanics** — how does it actually work under the hood? What data structures, algorithms, or engine internals are involved? Where is the implementation in the ClickHouse source tree (file/folder names) if you know?

2. **When to use vs avoid** — what concrete workloads does this help, and when would it hurt or be wrong? Give specific scale/latency trade-offs.

3. **Comparable features in other systems** — how does this compare with similar features in PostgreSQL, MySQL, BigQuery, Snowflake, Redshift, or DuckDB? Build my intuition by analogy.

4. **Common pitfalls and gotchas** — what trips engineers up in production? Subtle bugs, performance traps, surprising semantics?

5. **Worked example** — show me a small but realistic SQL or config example that demonstrates the concept end-to-end. Include the expected output where useful.

6. **Where to read more** — a short list of authoritative pointers (CH docs, blog posts, talks, source-code files).

Assume I have solid SQL fundamentals but I'm new to ClickHouse internals. Be technical but pragmatic; avoid marketing language.
Symptom
Cause
Fix
ON CLUSTER DDL hangs
One host unreachable; distributed_ddl_task_timeout exceeded.
system.distributed_ddl_queue.exception_text shows which host; fix it; rerun.
Code: 359. Table is already exists after recreate-with-same-zk-path
ZK still holds the old table's metadata.
DROP TABLE … ON CLUSTER … SYNC; (note SYNC).
Code: 81. Database 'analytics' doesn't exist
Created database without ON CLUSTER; only the initiator has it.
Always CREATE DATABASE … ON CLUSTER …;.
Authentication failed: password is incorrect, or there is no user with such name from outside
Default user is loopback-only when no password set.
Define users in users.d/. The demo's users.xml does this.
Prometheus scrape returns 404
<prometheus> block missing or pointing to wrong port.
Verify 02-prometheus.xml mounted; wget -qO- http://node:9363/metrics from inside.
Quota seems ignored
User didn't have <quota> set in users.xml; defaults to default quota (no limits).
Add <quota>name</quota> to the user.
12. Talking points for the live session
💬 Discuss with AI — click to view prompt
Paste into ChatGPT, Claude, Gemini, or any LLM chat.
I'm studying ClickHouse and working through the module "ClickHouse Cluster Deployment". I want to deeply understand the section: "Talking points for the live session".

Here is a brief excerpt from the material I'm reading:

"""
1. **There's no "primary" CH node.** Pick any healthy replica as the initiator for ON CLUSTER DDL. They all have the same view. 2. **`system.distributed_ddl_queue` is your audit log.** Show it before and after a `CREATE TABLE ON CLUSTER`. 3. **`cluster()` is for one-shot fan-outs.** No need to create a Distributed table for every diagnostic query. 4. **Profiles + quotas are CH's RBAC v0.** Roles + grants are the modern way; XML profiles are the bootstrap. 5. **Prometheus is one config block away.** Same metrics format every monitoring tool in the world speaks. 6. **TLS in production** isn't op...
"""

Please explain this concept in depth. Cover:

1. **Core mechanics** — how does it actually work under the hood? What data structures, algorithms, or engine internals are involved? Where is the implementation in the ClickHouse source tree (file/folder names) if you know?

2. **When to use vs avoid** — what concrete workloads does this help, and when would it hurt or be wrong? Give specific scale/latency trade-offs.

3. **Comparable features in other systems** — how does this compare with similar features in PostgreSQL, MySQL, BigQuery, Snowflake, Redshift, or DuckDB? Build my intuition by analogy.

4. **Common pitfalls and gotchas** — what trips engineers up in production? Subtle bugs, performance traps, surprising semantics?

5. **Worked example** — show me a small but realistic SQL or config example that demonstrates the concept end-to-end. Include the expected output where useful.

6. **Where to read more** — a short list of authoritative pointers (CH docs, blog posts, talks, source-code files).

Assume I have solid SQL fundamentals but I'm new to ClickHouse internals. Be technical but pragmatic; avoid marketing language.
There's no "primary" CH node. Pick any healthy replica as the
initiator for ON CLUSTER DDL. They all have the same view.
system.distributed_ddl_queue is your audit log. Show it before
and after a CREATE TABLE ON CLUSTER.
cluster() is for one-shot fan-outs. No need to create a
Distributed table for every diagnostic query.
Profiles + quotas are CH's RBAC v0. Roles + grants are the
modern way; XML profiles are the bootstrap.
Prometheus is one config block away. Same metrics format every
monitoring tool in the world speaks.
TLS in production isn't optional. Show the <openSSL> block;
generate dev certs in 60 s with mkcert.
Hot / warm / cold is a storage policy, not a feature flag. CH moves
parts down an ordered list of volumes on a TTL — and the bill for cheap
cold storage is paid back in RAM (more parts = more resident PK indexes)
and CPU (every cold read decompresses from scratch). Size both.
13. Going deeper
💬 Discuss with AI — click to view prompt
Paste into ChatGPT, Claude, Gemini, or any LLM chat.
I'm studying ClickHouse and working through the module "ClickHouse Cluster Deployment". I want to deeply understand the section: "Going deeper".

Here is a brief excerpt from the material I'm reading:

"""
- **Module 6** — query optimisation against this cluster's workload. - **Module 7** — coordinated `BACKUP TABLE … ON CLUSTER`. - **Module 8** — what happens when this cluster catches fire. - ClickHouse docs: <https://clickhouse.com/docs/en/operations/access-rights>
"""

Please explain this concept in depth. Cover:

1. **Core mechanics** — how does it actually work under the hood? What data structures, algorithms, or engine internals are involved? Where is the implementation in the ClickHouse source tree (file/folder names) if you know?

2. **When to use vs avoid** — what concrete workloads does this help, and when would it hurt or be wrong? Give specific scale/latency trade-offs.

3. **Comparable features in other systems** — how does this compare with similar features in PostgreSQL, MySQL, BigQuery, Snowflake, Redshift, or DuckDB? Build my intuition by analogy.

4. **Common pitfalls and gotchas** — what trips engineers up in production? Subtle bugs, performance traps, surprising semantics?

5. **Worked example** — show me a small but realistic SQL or config example that demonstrates the concept end-to-end. Include the expected output where useful.

6. **Where to read more** — a short list of authoritative pointers (CH docs, blog posts, talks, source-code files).

Assume I have solid SQL fundamentals but I'm new to ClickHouse internals. Be technical but pragmatic; avoid marketing language.
Module 6 — query optimisation against this cluster's workload.
Module 7 — coordinated BACKUP TABLE … ON CLUSTER.
Module 8 — what happens when this cluster catches fire.