ClickHouse is a column-oriented database management system (DBMS) for online analytical processing (OLAP). It's designed to handle massive volumes of data and execute complex analytical queries with sub-second response times. Think of it as a high-performance analytics engine that excels at aggregating, filtering, and analyzing billions of rows in real-time.
🏛️
Column-Oriented Storage
Data is stored by columns, not rows, enabling incredible compression and query speed for analytical workloads.
⚡
Blazing Fast
Process billions of rows per second. Queries that take minutes in traditional databases run in milliseconds.
📈
Horizontally Scalable
Scale out by adding more nodes. Handle petabytes of data across distributed clusters.
🔄
Real-Time Analytics
Ingest and query data simultaneously. Perfect for real-time dashboards and monitoring.
brew install clickhouse

# Start the server
clickhouse server

# In another terminal, connect
clickhouse-client
🐳 Docker (Fastest Way to Test)
docker run -d --name clickhouse-server \
  -p 8123:8123 \
  -p 9000:9000 \
  --ulimit nofile=262144:262144 \
  clickhouse/clickhouse-server

# Connect to the server
docker exec -it clickhouse-server clickhouse-client
2. First Steps - Create Database and Table
-- Connect to ClickHouse
clickhouse-client

-- Create a database
CREATE DATABASE analytics;

-- Use the database
USE analytics;

-- Create your first table
CREATE TABLE events (
    event_date Date,
    event_time DateTime,
    user_id UInt32,
    event_type String,
    country String,
    revenue Decimal(10, 2)
) ENGINE = MergeTree()
PARTITION BY toYYYYMM(event_date)
ORDER BY (event_date, user_id);

-- Insert sample data
INSERT INTO events VALUES
    ('2026-01-01', '2026-01-01 10:00:00', 1001, 'purchase', 'US', 99.99),
    ('2026-01-01', '2026-01-01 11:30:00', 1002, 'click', 'UK', 0.00),
    ('2026-01-01', '2026-01-01 14:20:00', 1003, 'purchase', 'CA', 149.50);

-- Query the data
SELECT
    country,
    COUNT(*) as event_count,
    SUM(revenue) as total_revenue
FROM events
WHERE event_type = 'purchase'
GROUP BY country
ORDER BY total_revenue DESC;
3. Verify Installation
-- Check server version
SELECT version();

-- Check server uptime
SELECT uptime();

-- List databases
SHOW DATABASES;

-- Show current system tables
SELECT table, engine FROM system.tables WHERE database = 'system' LIMIT 5;
-- Drop database
DROP DATABASE my_db;

-- Show all databases
SHOW DATABASES;
Table Operations (MergeTree Family)
-- Basic MergeTree table
CREATE TABLE logs (
    timestamp DateTime,
    level String,
    message String,
    user_id UInt32
) ENGINE = MergeTree()
PARTITION BY toYYYYMM(timestamp)
ORDER BY (timestamp, user_id);

-- Table with TTL (auto-deletion after 30 days)
CREATE TABLE sessions (
    session_id String,
    created_at DateTime,
    user_id UInt32,
    session_data String
) ENGINE = MergeTree()
PARTITION BY toYYYYMM(created_at)
ORDER BY (created_at, session_id)
TTL created_at + INTERVAL 30 DAY;

-- Drop table
DROP TABLE logs;

-- Show table structure
DESCRIBE TABLE logs;

-- Show create statement
SHOW CREATE TABLE logs;
Data Insertion
-- Insert single row
INSERT INTO logs VALUES ('2026-01-22 10:00:00', 'INFO', 'User logged in', 1001);

-- Insert multiple rows
INSERT INTO logs VALUES
    ('2026-01-22 10:01:00', 'INFO', 'Page viewed', 1001),
    ('2026-01-22 10:02:00', 'ERROR', 'Connection failed', 1002);

-- Insert from SELECT
INSERT INTO logs SELECT * FROM logs_temp WHERE level = 'ERROR';

-- Insert from CSV file
clickhouse-client --query="INSERT INTO logs FORMAT CSV" < data.csv

-- Insert from JSON
cat data.json | clickhouse-client --query="INSERT INTO logs FORMAT JSONEachRow"
Query Operations
-- Basic SELECT
SELECT * FROM logs WHERE level = 'ERROR' LIMIT 10;

-- Aggregation
SELECT
    level,
    COUNT(*) as count,
    countDistinct(user_id) as unique_users
FROM logs
WHERE timestamp >= today() - INTERVAL 7 DAY
GROUP BY level;

-- Time-series analysis
SELECT
    toStartOfHour(timestamp) as hour,
    COUNT(*) as events_per_hour
FROM logs
WHERE timestamp >= now() - INTERVAL 24 HOUR
GROUP BY hour
ORDER BY hour;

-- Advanced: WITH clause
WITH top_users AS (
    SELECT user_id, COUNT(*) as cnt
    FROM logs
    GROUP BY user_id
    HAVING cnt > 100
)
SELECT l.*
FROM logs l
JOIN top_users t ON l.user_id = t.user_id;
System & Monitoring Commands
-- Check disk usage
SELECT
    database,
    table,
    formatReadableSize(sum(bytes)) as size
FROM system.parts
WHERE active
GROUP BY database, table
ORDER BY sum(bytes) DESC;

-- Check query performance
SELECT
    query,
    query_duration_ms,
    read_rows,
    read_bytes
FROM system.query_log
WHERE type = 'QueryFinish'
ORDER BY query_duration_ms DESC
LIMIT 10;

-- Check running queries
SELECT
    user,
    query_id,
    query,
    elapsed
FROM system.processes;

-- Kill a query
KILL QUERY WHERE query_id = 'xxx-xxx-xxx';
✨ Best Practices
1. Data Modeling
❌ Bad
-- Normalized schema (like MySQL)
CREATE TABLE users (
    user_id UInt32,
    name String
) ENGINE = MergeTree() ORDER BY user_id;

CREATE TABLE events (
    event_id UInt64,
    user_id UInt32,
    event_type String
) ENGINE = MergeTree() ORDER BY event_id;

-- Requires expensive JOIN
SELECT u.name, COUNT(*)
FROM events e
JOIN users u ON e.user_id = u.user_id
GROUP BY u.name;
Problem: JOINs are expensive in ClickHouse
✅ Good
-- Denormalized schema
CREATE TABLE events (
    event_id UInt64,
    user_id UInt32,
    user_name String,  -- Denormalized!
    event_type String
) ENGINE = MergeTree()
ORDER BY (event_id, user_id);

-- No JOIN needed!
SELECT
    user_name,
    COUNT(*)
FROM events
GROUP BY user_name;
Benefit: 10-100x faster queries, no JOINs
2. Partition Key Selection
❌ Bad
-- Too many partitions (by day)
CREATE TABLE logs (
    timestamp DateTime,
    message String
) ENGINE = MergeTree()
PARTITION BY toDate(timestamp)
ORDER BY timestamp;
Problem: Creates 365+ partitions per year, degrades performance
✅ Good
-- Reasonable partitions (by month)
CREATE TABLE logs (
    timestamp DateTime,
    message String
) ENGINE = MergeTree()
PARTITION BY toYYYYMM(timestamp)
ORDER BY timestamp;
Benefit: Only 12 partitions per year, better performance, easier to drop old data
3. Ordering Key Selection
❌ Bad
-- High cardinality first
CREATE TABLE events (
    event_id UUID,
    user_id UInt32,
    country String,
    timestamp DateTime
) ENGINE = MergeTree()
ORDER BY (event_id, timestamp);  -- UUID first!
Problem: Poor data compression, inefficient queries
✅ Good
-- Low cardinality first
CREATE TABLE events (
    event_id UUID,
    user_id UInt32,
    country String,
    timestamp DateTime
) ENGINE = MergeTree()
ORDER BY (country, timestamp, user_id);  -- Low to high cardinality!
Benefit: Better compression, faster queries on country and time ranges
4. Avoid Frequent Updates/Deletes
⚠️ Important: ClickHouse is NOT designed for OLTP workloads
Inserts: Batch them! Insert 10,000+ rows at once, not one by one
Updates: Very slow. Use ReplacingMergeTree if you must update
Deletes: Very slow. Use TTL for automatic deletion or ALTER DELETE for rare cases
5. Hardware Considerations
💾 Storage
SSD is mandatory for good performance
NVMe SSDs are ideal for hot data
Plan for 10-100x compression ratio
🧠 Memory
Minimum: 8GB per server
Recommended: 64-256GB for production
More RAM = better query performance
⚙️ CPU
More cores = better parallelization
Minimum: 8 cores
Recommended: 16-64 cores for production
🌐 Network
10 Gbps network for distributed clusters
Low latency between nodes is critical
Use dedicated network for replication
🎯 When to Use ClickHouse
✅ Good For
Real-time analytics and dashboards
Time-series data (logs, metrics, events)
Business intelligence and reporting
Click-stream and web analytics
IoT sensor data analysis
Financial market data
Monitoring and observability (like Grafana)
Data warehousing for analytical queries
Large-scale aggregations (billions of rows)
Append-only workloads
❌ Not Good For
Transactional workloads (use MySQL/PostgreSQL)
Frequent updates/deletes (use OLTP databases)
Key-value lookups (use Redis/DynamoDB)
Document storage (use MongoDB/Elasticsearch)
Full-text search (use Elasticsearch/Meilisearch)
Small datasets (< 100 million rows)
Complex transactions with ACID guarantees
Graph databases (use Neo4j)
Real-time row-by-row processing
🏆 Real-World Results
100-1000x
Faster Than MySQL
Analytical queries on large datasets run 100-1000x faster than traditional row-oriented databases
Billions/sec
Row Processing Speed
ClickHouse can process billions of rows per second on modern hardware
10-100x
Compression Ratio
Achieve 10-100x compression ratios with column-oriented storage and codecs
< 1 sec
Query Response Time
Sub-second response times for complex aggregations on billions of rows
Use Case Examples
📊 Web Analytics Platform
Challenge: Process 10 billion events per day, provide real-time dashboards
Solution: ClickHouse with Kafka streaming
Results:
Query response time: < 500ms for complex aggregations
Storage: 10TB raw data compressed to 500GB (20x compression)
Infrastructure cost reduced by 70% vs traditional data warehouse
📈 Real-Time Monitoring System
Challenge: Monitor 100,000 servers generating 1 million metrics/sec
Solution: ClickHouse cluster with 3 shards × 2 replicas
Results:
Ingestion rate: 1M events/sec sustained
Query latency: 200-500ms for real-time alerts
Data retention: 90 days with automatic TTL cleanup
💳 Financial Transaction Analytics
Challenge: Analyze 500 million transactions per day for fraud detection
Solution: ClickHouse with ReplacingMergeTree for deduplication
Results:
Fraud detection queries: < 1 second on 6 months of data
Report generation time reduced from 2 hours to 5 minutes
Compliance reporting automated with materialized views
📋 Ready-to-Use Templates
Template 1: Event Tracking Table
-- Perfect for web/app analytics, user behavior tracking
CREATE TABLE events (
    -- Time dimension
    event_date Date,
    event_time DateTime,

    -- User dimension
    user_id UInt64,
    session_id String,

    -- Event details
    event_type LowCardinality(String),
    event_name String,
    event_properties String,  -- JSON string

    -- Context
    platform LowCardinality(String),  -- web, ios, android
    country LowCardinality(String),
    city String,
    device_type LowCardinality(String),

    -- Optional
    revenue Decimal(10, 2) DEFAULT 0
) ENGINE = MergeTree()
PARTITION BY toYYYYMM(event_date)
ORDER BY (event_date, user_id, event_time)
TTL event_date + INTERVAL 2 YEAR;  -- Auto-delete after 2 years

-- Example queries
-- Daily active users
SELECT toDate(event_time) as date, countDistinct(user_id) as dau
FROM events
WHERE event_date >= today() - 30
GROUP BY date ORDER BY date;

-- Top events by type
SELECT event_type, COUNT(*) as count
FROM events
WHERE event_date = today()
GROUP BY event_type ORDER BY count DESC LIMIT 10;
Template 2: Application Logs Table
-- Perfect for centralized logging, debugging, monitoring
CREATE TABLE logs (
    -- Timestamp
    timestamp DateTime,
    timestamp_ms DateTime64(3),  -- Millisecond precision

    -- Log metadata
    level LowCardinality(String),  -- DEBUG, INFO, WARN, ERROR
    logger_name LowCardinality(String),

    -- Message
    message String,
    exception String,

    -- Context
    host LowCardinality(String),
    service LowCardinality(String),
    environment LowCardinality(String),  -- dev, staging, prod

    -- Trace info
    trace_id String,
    span_id String,

    -- Additional fields
    user_id UInt64 DEFAULT 0,
    request_id String DEFAULT '',
    extra_fields String  -- JSON for flexible fields
) ENGINE = MergeTree()
PARTITION BY toYYYYMM(timestamp)
ORDER BY (level, service, timestamp)
TTL timestamp + INTERVAL 90 DAY;  -- Keep logs for 90 days

-- Example queries
-- Error rate by service
SELECT
    service,
    countIf(level = 'ERROR') as errors,
    count() as total,
    errors / total * 100 as error_rate_pct
FROM logs
WHERE timestamp >= now() - INTERVAL 1 HOUR
GROUP BY service
ORDER BY error_rate_pct DESC;

-- Find errors with stack traces
SELECT timestamp, service, message, exception
FROM logs
WHERE level = 'ERROR'
  AND exception != ''
  AND timestamp >= now() - INTERVAL 24 HOUR
ORDER BY timestamp DESC
LIMIT 100;
Template 3: Metrics/Time-Series Table
-- Perfect for system metrics, IoT sensors, monitoring
CREATE TABLE metrics (
    -- Time dimension
    timestamp DateTime,

    -- Metric identity
    metric_name LowCardinality(String),

    -- Tags/Labels (for grouping)
    host LowCardinality(String),
    service LowCardinality(String),
    region LowCardinality(String),
    environment LowCardinality(String),

    -- Values
    value Float64,

    -- Optional: store all tags as JSON for flexibility
    tags String
) ENGINE = MergeTree()
PARTITION BY toYYYYMM(timestamp)
ORDER BY (metric_name, host, timestamp)
TTL timestamp + INTERVAL 365 DAY;

-- Example queries
-- Average CPU usage per host (last hour)
SELECT
    host,
    AVG(value) as avg_cpu
FROM metrics
WHERE metric_name = 'cpu.usage'
  AND timestamp >= now() - INTERVAL 1 HOUR
GROUP BY host
ORDER BY avg_cpu DESC;

-- P95 response time over time
SELECT
    toStartOfMinute(timestamp) as minute,
    quantile(0.95)(value) as p95_response_time
FROM metrics
WHERE metric_name = 'http.response_time'
  AND timestamp >= now() - INTERVAL 24 HOUR
GROUP BY minute
ORDER BY minute;
Template 4: User Sessions Table
-- Perfect for session analytics, user journey tracking
CREATE TABLE sessions (
    -- Session info
    session_id String,
    user_id UInt64,

    -- Time
    session_start DateTime,
    session_end DateTime,
    duration_seconds UInt32,

    -- Session attributes
    device_type LowCardinality(String),
    browser LowCardinality(String),
    os LowCardinality(String),
    country LowCardinality(String),
    city String,

    -- Engagement metrics
    page_views UInt32,
    events_count UInt32,
    is_bounce UInt8,  -- 0 or 1

    -- Conversion
    has_conversion UInt8,
    revenue Decimal(10, 2) DEFAULT 0,

    -- Entry/exit
    landing_page String,
    exit_page String,

    -- Referral
    referrer String,
    utm_source String,
    utm_campaign String
) ENGINE = MergeTree()
PARTITION BY toYYYYMM(session_start)
ORDER BY (session_start, user_id)
TTL session_start + INTERVAL 2 YEAR;

-- Example queries
-- Average session duration by device
SELECT
    device_type,
    AVG(duration_seconds) as avg_duration,
    COUNT(*) as session_count
FROM sessions
WHERE session_start >= today() - 7
GROUP BY device_type;

-- Bounce rate by landing page
SELECT
    landing_page,
    COUNT(*) as sessions,
    countIf(is_bounce = 1) as bounces,
    bounces / sessions * 100 as bounce_rate
FROM sessions
WHERE session_start >= today() - 30
GROUP BY landing_page
HAVING sessions > 100
ORDER BY bounce_rate DESC
LIMIT 20;
🔥 Advanced Patterns
1. Using Materialized Views for Pre-Aggregation
-- Source table
CREATE TABLE events (
    event_time DateTime,
    user_id UInt64,
    event_type String,
    revenue Decimal(10, 2)
) ENGINE = MergeTree()
ORDER BY (event_time, user_id);

-- Materialized view that pre-aggregates data
CREATE MATERIALIZED VIEW events_hourly_mv
ENGINE = SummingMergeTree()
PARTITION BY toYYYYMM(hour)
ORDER BY (hour, event_type)
AS SELECT
    toStartOfHour(event_time) as hour,
    event_type,
    COUNT(*) as event_count,
    countDistinct(user_id) as unique_users,
    SUM(revenue) as total_revenue
FROM events
GROUP BY hour, event_type;

-- Now queries on hourly data are instant!
SELECT * FROM events_hourly_mv WHERE hour >= today() - 7;
2. Optimizing with LowCardinality
-- LowCardinality optimizes storage and query speed for columns with few unique values
CREATE TABLE events (
    event_time DateTime,
    user_id UInt64,

    -- These columns have < 10,000 unique values
    event_type LowCardinality(String),
    country LowCardinality(String),
    platform LowCardinality(String),

    -- Don't use LowCardinality for high-cardinality columns!
    user_email String  -- Millions of unique values
) ENGINE = MergeTree()
ORDER BY (event_time, user_id);

-- Benefits: 2-10x better compression and query speed for GROUP BY operations
3. Using Codecs for Better Compression
-- Different codecs for different data types
CREATE TABLE metrics (
    timestamp DateTime CODEC(DoubleDelta, ZSTD),  -- Great for timestamps
    metric_name LowCardinality(String),
    value Float64 CODEC(Gorilla, ZSTD),  -- Gorilla codec for floating point
    counter UInt64 CODEC(Delta, ZSTD),   -- Delta codec for incrementing values
    message String CODEC(ZSTD(3))        -- ZSTD level 3 for strings
) ENGINE = MergeTree()
ORDER BY (metric_name, timestamp);

-- Result: 2-5x better compression than default!
4. Sampling for Faster Queries
-- Add sampling key to table
CREATE TABLE events (
    event_time DateTime,
    user_id UInt64,
    event_type String
) ENGINE = MergeTree()
ORDER BY (event_time, user_id)
SAMPLE BY intHash32(user_id);  -- Enable sampling

-- Query 10% of data (10x faster for approximate results)
SELECT
    event_type,
    COUNT(*) * 10 as estimated_count  -- Multiply by sampling rate
FROM events
SAMPLE 0.1  -- Sample 10% of data
WHERE event_time >= today() - 30
GROUP BY event_type;
5. Distributed Queries Across Clusters
-- Distributed table that queries all shards
CREATE TABLE events_distributed AS events
ENGINE = Distributed(
    'my_cluster',      -- Cluster name (defined in config)
    'default',         -- Database name
    'events',          -- Local table name
    rand()             -- Sharding key (random distribution)
);

-- Write to distributed table (data goes to appropriate shard)
INSERT INTO events_distributed VALUES (...);

-- Read from distributed table (queries all shards in parallel)
SELECT COUNT(*) FROM events_distributed;
-- ClickHouse automatically combines results from all shards!
📚 Related Resources
📘 View in Notion
Access this module in your Notion workspace for note-taking and tracking your progress.
After completing Module 1, you should be comfortable with:
✅ Understanding ClickHouse architecture and when to use it
✅ Installing and running ClickHouse (single node)
✅ Creating databases and basic MergeTree tables
✅ Inserting data and running analytical queries
✅ Understanding column-oriented storage benefits
Ready for Module 2? Next, we'll dive deep into Table Engines & Data Modeling!
🐳 Hands-on Docker Demo for this Module
A self-contained ClickHouse stack you can run locally. Every step is reproducible; the README below walks through each concept with diagrams and measured outcomes.
cd code-examples/demos/module-1-fundamentals
./up.sh        # bring stack up, wait for health
./run.sh       # run the demo (idempotent — re-runnable)
./down.sh      # tear down + drop volumes
📺 Live demo capture
Recorded with vhs: the actual terminal output from ./run.sh running on this very stack.
Animated GIF, ~566 KB. Right-click → open in new tab to view full-size.
✨ Animated concept diagrams
Inline SVG animations — no plugins, native browser playback. Each visualises a key flow this module covers.
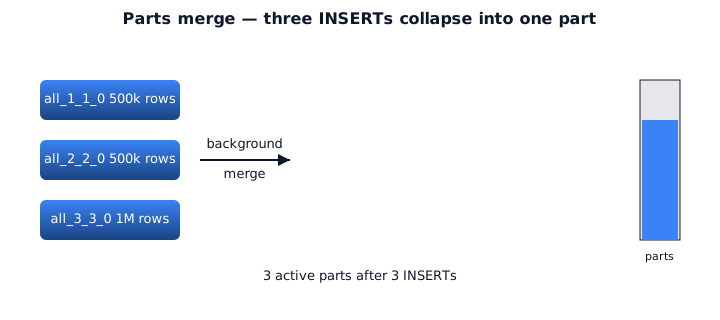
Parts merge
📚 ClickHouse reference visuals
Curated from the official ClickHouse documentation and engineering blog (and Altinity's docs/blog) — the same diagrams the broader CH community uses to explain these concepts. Click any image to read the source.
ClickHouse Docs
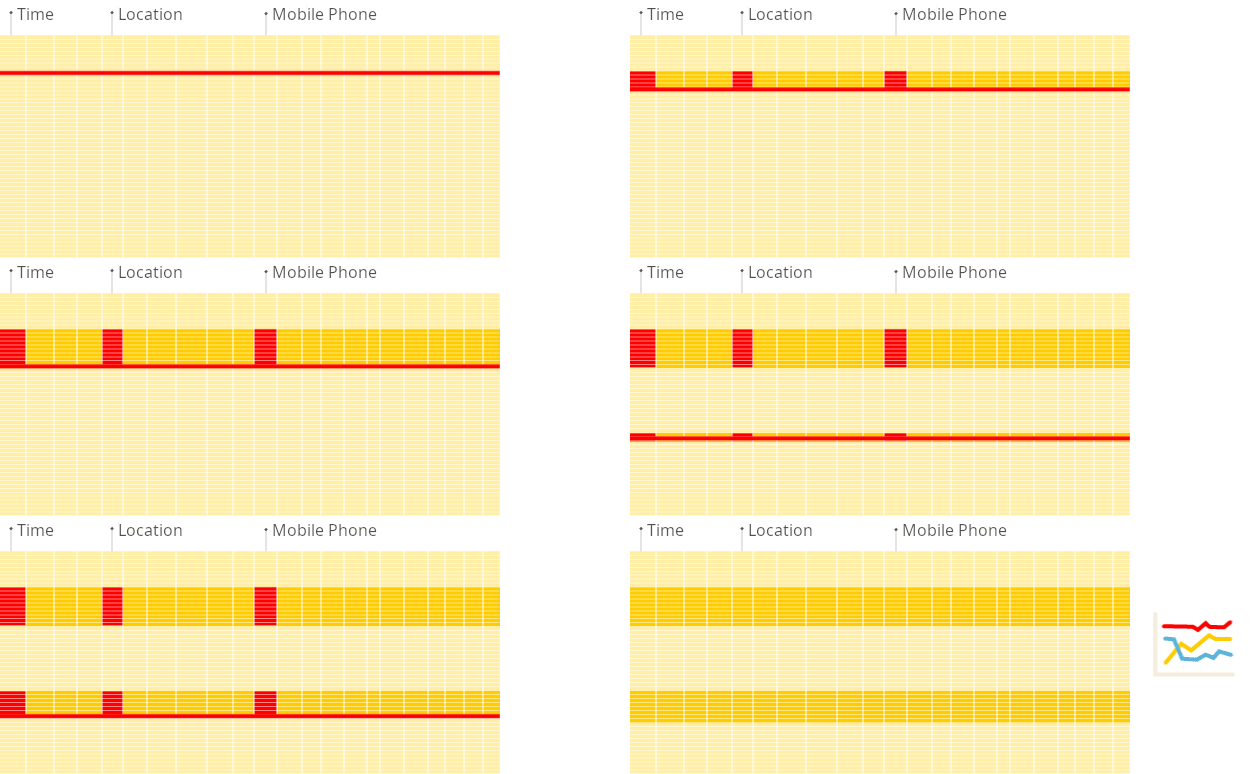
Animated row-oriented storage layout (data laid out per-row)
ClickHouse Docs
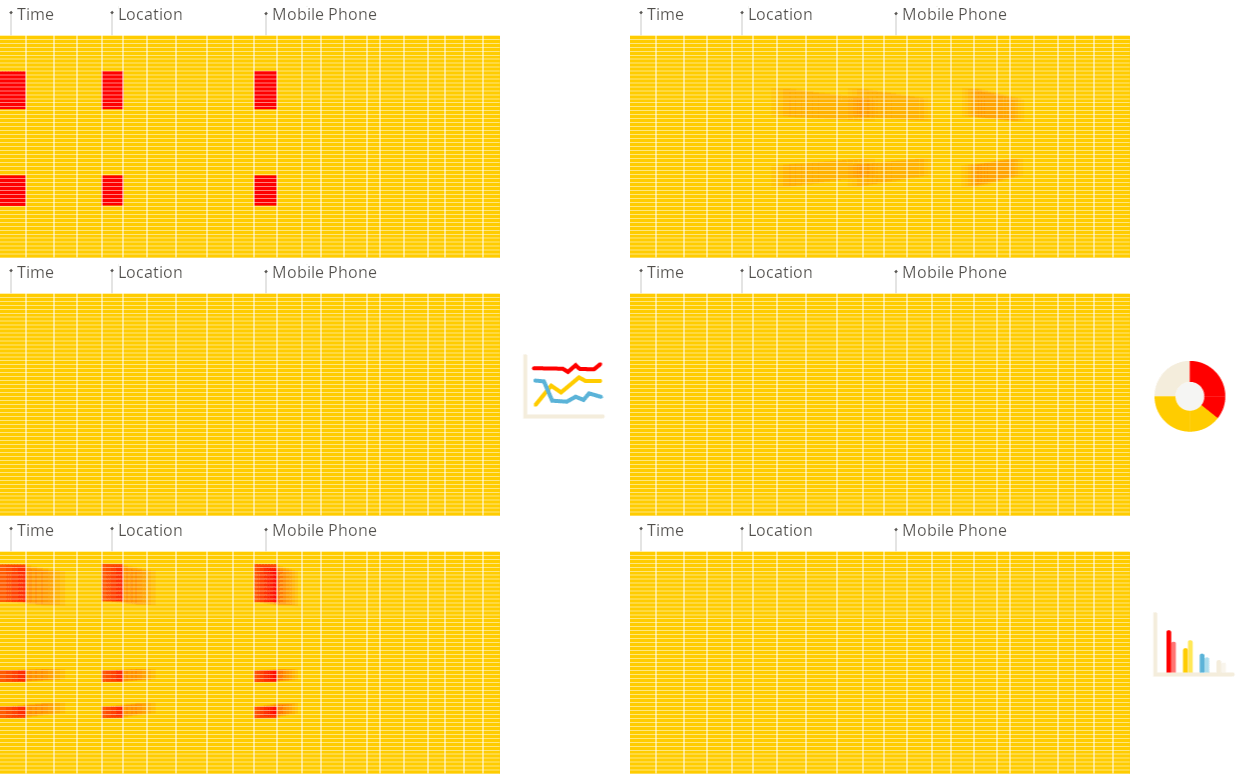
Animated columnar storage layout (data laid out per-column)
ClickHouse Engineering
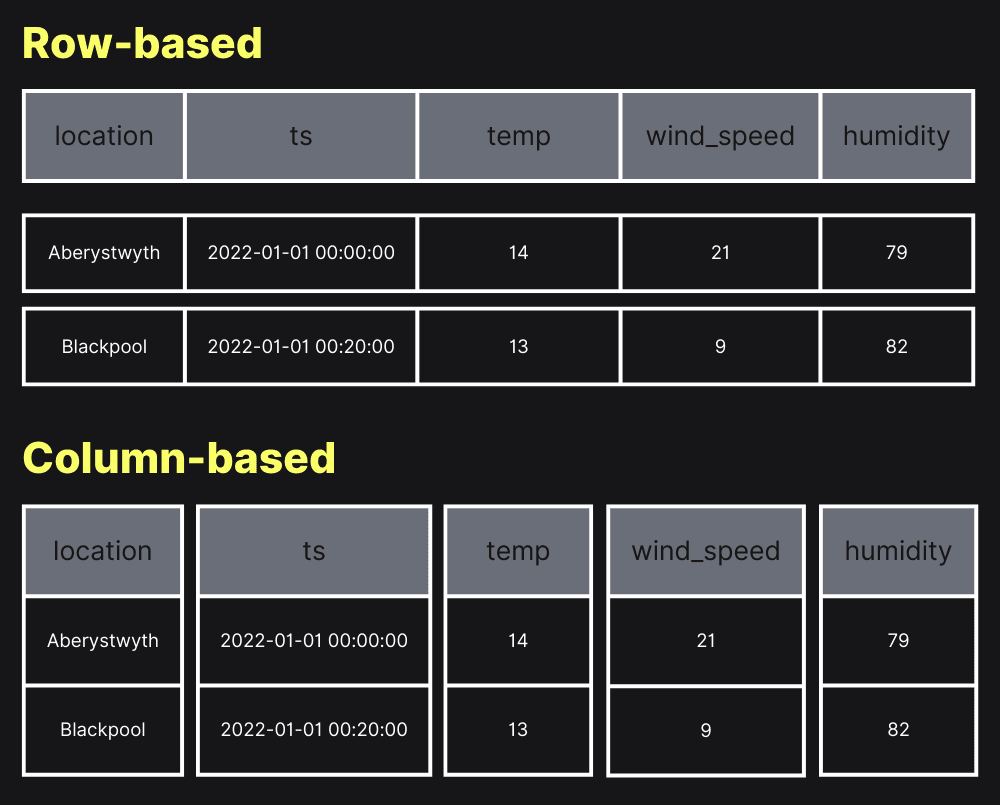
Row store vs column store: how the same table is physically laid out
ClickHouse Engineering
Why columns compress better than rows
ClickHouse Engineering
Columnar layout enables vectorised execution over batches
📚 Full module reference
Module 1 — ClickHouse Fundamentals
Audience: engineers who'll deploy, query, or operate ClickHouse in
production. Prerequisites: any prior SQL experience, a working Docker
install. Time: ~45 min reading + 30 min hands-on.
This module establishes the mental model for everything that follows. By
the end you will be able to:
Explain why ClickHouse is fast (and where it isn't).
Read on-disk part naming and tell active parts from inactive ones.
Pick a sensible ORDER BY / PARTITION BY / PRIMARY KEY.
Choose appropriate codecs for time-series and integer columns.
Use TTL to drop or move aging data automatically.
Use system.* tables to see exactly what the engine is doing.
1. The 30-second pitch
💬 Discuss with AI — click to view prompt
Paste into ChatGPT, Claude, Gemini, or any LLM chat.
I'm studying ClickHouse and working through the module "ClickHouse Fundamentals". I want to deeply understand the section: "The 30-second pitch".

Here is a brief excerpt from the material I'm reading:

"""
ClickHouse is a **column-oriented OLAP DBMS** designed for one job: scan huge tables fast, returning aggregations in milliseconds. Three properties make it work: | Property                  | What it buys you                                                                                | | **Columnar storage**      | Each column is its own file → analytical queries read only the columns they touch.              | | **Vectorised execution**  | Operators process arrays of values, not rows-one-at-a-time → SIMD-friendly, cache-friendly.     | | **Sparse primary index**  | One mark per ~8192 rows...
"""

Please explain this concept in depth. Cover:

1. **Core mechanics** — how does it actually work under the hood? What data structures, algorithms, or engine internals are involved? Where is the implementation in the ClickHouse source tree (file/folder names) if you know?

2. **When to use vs avoid** — what concrete workloads does this help, and when would it hurt or be wrong? Give specific scale/latency trade-offs.

3. **Comparable features in other systems** — how does this compare with similar features in PostgreSQL, MySQL, BigQuery, Snowflake, Redshift, or DuckDB? Build my intuition by analogy.

4. **Common pitfalls and gotchas** — what trips engineers up in production? Subtle bugs, performance traps, surprising semantics?

5. **Worked example** — show me a small but realistic SQL or config example that demonstrates the concept end-to-end. Include the expected output where useful.

6. **Where to read more** — a short list of authoritative pointers (CH docs, blog posts, talks, source-code files).

Assume I have solid SQL fundamentals but I'm new to ClickHouse internals. Be technical but pragmatic; avoid marketing language.
ClickHouse is a column-oriented OLAP DBMS designed for one job: scan
huge tables fast, returning aggregations in milliseconds. Three properties
make it work:
Property
What it buys you
Columnar storage
Each column is its own file → analytical queries read only the columns they touch.
Vectorised execution
Operators process arrays of values, not rows-one-at-a-time → SIMD-friendly, cache-friendly.
Sparse primary index
One mark per ~8192 rows → indexes stay tiny even on trillion-row tables.
Aggressive compression
Per-column codecs (LZ4, ZSTD, Delta, T64) typically reach 10–100× compression on real data.
It is not a transactional database. There is no row-level UPDATE/DELETE
in the traditional sense, no foreign keys, no MVCC. It excels at append-mostly
analytical workloads.
2. Storage architecture
💬 Discuss with AI — click to view prompt
Paste into ChatGPT, Claude, Gemini, or any LLM chat.
I'm studying ClickHouse and working through the module "ClickHouse Fundamentals". I want to deeply understand the section: "Storage architecture".

Here is a brief excerpt from the material I'm reading:

"""
### Files inside one part — what each is for | File                              | Purpose                                                                | | `<column>.bin`                    | The column's compressed data, in granule order.                        | | `<column>.mrk2` (or `.mrk`)       | Marks: byte offset into `.bin` for each granule (so reads can seek).   | | `primary.idx`                     | Sparse primary key — one row per granule.                              | | `count.txt`                       | Cached row count of this part.                                         |
"""

Please explain this concept in depth. Cover:

1. **Core mechanics** — how does it actually work under the hood? What data structures, algorithms, or engine internals are involved? Where is the implementation in the ClickHouse source tree (file/folder names) if you know?

2. **When to use vs avoid** — what concrete workloads does this help, and when would it hurt or be wrong? Give specific scale/latency trade-offs.

3. **Comparable features in other systems** — how does this compare with similar features in PostgreSQL, MySQL, BigQuery, Snowflake, Redshift, or DuckDB? Build my intuition by analogy.

4. **Common pitfalls and gotchas** — what trips engineers up in production? Subtle bugs, performance traps, surprising semantics?

5. **Worked example** — show me a small but realistic SQL or config example that demonstrates the concept end-to-end. Include the expected output where useful.

6. **Where to read more** — a short list of authoritative pointers (CH docs, blog posts, talks, source-code files).

Assume I have solid SQL fundamentals but I'm new to ClickHouse internals. Be technical but pragmatic; avoid marketing language.
Marks: byte offset into .bin for each granule (so reads can seek).
primary.idx
Sparse primary key — one row per granule.
count.txt
Cached row count of this part.
columns.txt
Column-name → type mapping for this part.
checksums.txt
SHA1 of every other file. Reads against this to detect corruption.
default_compression_codec.txt
Codec used for any column that didn't specify one.
minmax_<col>.idx
Min/max of partition columns — partition-pruning input.
partition.dat
Serialized partition value (e.g. 202601).
3. The MergeTree engine
💬 Discuss with AI — click to view prompt
Paste into ChatGPT, Claude, Gemini, or any LLM chat.
I'm studying ClickHouse and working through the module "ClickHouse Fundamentals". I want to deeply understand the section: "The MergeTree engine".

Here is a brief excerpt from the material I'm reading:

"""
`MergeTree` is *the* default table engine. Everything that does replication, deduplication, TTL, or sharding is a variant of it. ### Required + optional clauses ### How `ORDER BY` interacts with `PRIMARY KEY` - `ORDER BY` is required and defines **on-disk sort order**. - `PRIMARY KEY` is the **sparse index**. If omitted (the common case), it equals `ORDER BY`. If specified, **it must be a prefix of ORDER BY**. - Common pattern: `PRIMARY KEY (a, b)` + `ORDER BY (a, b, c, d)` — the index is small (only `a, b` go into `primary.idx`) but rows are fully sorted, so `c, d` filters still get sequentia...
"""

Please explain this concept in depth. Cover:

1. **Core mechanics** — how does it actually work under the hood? What data structures, algorithms, or engine internals are involved? Where is the implementation in the ClickHouse source tree (file/folder names) if you know?

2. **When to use vs avoid** — what concrete workloads does this help, and when would it hurt or be wrong? Give specific scale/latency trade-offs.

3. **Comparable features in other systems** — how does this compare with similar features in PostgreSQL, MySQL, BigQuery, Snowflake, Redshift, or DuckDB? Build my intuition by analogy.

4. **Common pitfalls and gotchas** — what trips engineers up in production? Subtle bugs, performance traps, surprising semantics?

5. **Worked example** — show me a small but realistic SQL or config example that demonstrates the concept end-to-end. Include the expected output where useful.

6. **Where to read more** — a short list of authoritative pointers (CH docs, blog posts, talks, source-code files).

Assume I have solid SQL fundamentals but I'm new to ClickHouse internals. Be technical but pragmatic; avoid marketing language.
MergeTree is the default table engine. Everything that does
replication, deduplication, TTL, or sharding is a variant of it.
Required + optional clauses
CREATE TABLE events (
    event_time  DateTime,
    user_id     UInt32,
    revenue     Float64
)
ENGINE = MergeTree
ORDER BY (event_time, user_id)        -- 1. defines on-disk sort + default PK
PARTITION BY toYYYYMM(event_time)     -- 2. optional. keeps related rows together
PRIMARY KEY (event_time)              -- 3. optional. must be PREFIX of ORDER BY
SAMPLE BY intHash32(user_id)          -- 4. optional. enables SAMPLE clause
TTL event_time + INTERVAL 90 DAY      -- 5. optional. auto-delete or move
SETTINGS
    index_granularity = 8192,         -- rows per mark (default)
    min_rows_for_wide_part = 10000000;
How ORDER BY interacts with PRIMARY KEY
ORDER BY is required and defines on-disk sort order.
PRIMARY KEY is the sparse index. If omitted (the common case), it
equals ORDER BY. If specified, it must be a prefix of ORDER BY.
Common pattern: PRIMARY KEY (a, b) + ORDER BY (a, b, c, d) — the
index is small (only a, b go into primary.idx) but rows are
fully sorted, so c, d filters still get sequential reads.
index_granularity = 8192
One mark is written per 8192 rows in the part.
The primary key has one entry per mark, not per row. That's why
PK on a 100-billion-row table fits in a few hundred MB instead of TB.
Tradeoff: highly selective point lookups can't be more selective than a
granule. For point lookups, add a skip-index or a secondary table.
A WHERE event_time BETWEEN '2026-01-01 06:00' AND '2026-01-01 12:00'
query reads primary.idx, finds only the granules that could contain
matching rows, and reads just those <col>.bin byte ranges. A 2-billion-row
scan becomes a 100K-row scan.
4. Parts, partitions, merges
💬 Discuss with AI — click to view prompt
Paste into ChatGPT, Claude, Gemini, or any LLM chat.
I'm studying ClickHouse and working through the module "ClickHouse Fundamentals". I want to deeply understand the section: "Parts, partitions, merges".

Here is a brief excerpt from the material I'm reading:

"""
A **part** is an immutable directory under `/var/lib/clickhouse/data/<db>/<table>/`. Every `INSERT` produces a new part. Background workers later **merge** small parts into bigger ones, sorted by the table's `ORDER BY`. This is the engine's name. ### Decoding a part name If the table has `PARTITION BY toYYYYMM(...)`, parts look like `202601_5_5_0` instead — partition `202601`, blocks 5..5, level 0. ### Why merges matter - Without merges: one tiny part per insert → millions of small files → the file system and the engine both choke. - With merges: a logarithmic number of parts; reads stream seq...
"""

Please explain this concept in depth. Cover:

1. **Core mechanics** — how does it actually work under the hood? What data structures, algorithms, or engine internals are involved? Where is the implementation in the ClickHouse source tree (file/folder names) if you know?

2. **When to use vs avoid** — what concrete workloads does this help, and when would it hurt or be wrong? Give specific scale/latency trade-offs.

3. **Comparable features in other systems** — how does this compare with similar features in PostgreSQL, MySQL, BigQuery, Snowflake, Redshift, or DuckDB? Build my intuition by analogy.

4. **Common pitfalls and gotchas** — what trips engineers up in production? Subtle bugs, performance traps, surprising semantics?

5. **Worked example** — show me a small but realistic SQL or config example that demonstrates the concept end-to-end. Include the expected output where useful.

6. **Where to read more** — a short list of authoritative pointers (CH docs, blog posts, talks, source-code files).

Assume I have solid SQL fundamentals but I'm new to ClickHouse internals. Be technical but pragmatic; avoid marketing language.
A part is an immutable directory under
/var/lib/clickhouse/data/<db>/<table>/. Every INSERT produces a new
part. Background workers later merge small parts into bigger ones,
sorted by the table's ORDER BY. This is the engine's name.
        all_  1_3_1
        ─┬─   ─┬───
         │     │  └── merge level (0 = freshly inserted, 1 = 1st merge, …)
         │     │
         │     └── min_block..max_block of source parts
         │
         └── partition (here, all rows in one partition called 'all')
If the table has PARTITION BY toYYYYMM(...), parts look like
202601_5_5_0 instead — partition 202601, blocks 5..5, level 0.
Why merges matter
Without merges: one tiny part per insert → millions of small files →
the file system and the engine both choke.
With merges: a logarithmic number of parts; reads stream sequentially;
query planning visits few directories.
Don't insert one row at a time — batch! 1k–100k rows per insert is
the sweet spot. Single-row inserts are the #1 cause of "ClickHouse is
slow" tickets.
Partitions ≠ shards
A partition is a logical group of parts within one node (one
directory tree per partition value). A shard is a whole node in a
cluster. Use partitioning to drop old data cheaply (DROP PARTITION) and
to bound merge work; use sharding to spread data across machines.
Rule of thumb: partition by month for most workloads. Day-partitioning
is for very high-throughput tables (>1B rows/day). Year-partitioning is
for cold archival. Anything more granular than the access pattern is
counterproductive — too many partitions = slow merges + metadata bloat.
5. Compression and codecs
💬 Discuss with AI — click to view prompt
Paste into ChatGPT, Claude, Gemini, or any LLM chat.
I'm studying ClickHouse and working through the module "ClickHouse Fundamentals". I want to deeply understand the section: "Compression and codecs".

Here is a brief excerpt from the material I'm reading:

"""
Every column is compressed independently. Codecs can be **stacked**. | Codec                   | Best for                                                              | | `LZ4` (default)         | Anything; very fast, ~2× compression on text, more on integers.       | | `ZSTD(level)`           | Larger compression than LZ4 (~30–50% smaller), slower. Levels 1–22.   | | `Delta(N)`              | Monotonic series (timestamps, counters). Stores differences.          | | `DoubleDelta`           | Timestamps with regular intervals (e.g. metrics every 1s).            | | `Gorilla`               | Flo...
"""

Please explain this concept in depth. Cover:

1. **Core mechanics** — how does it actually work under the hood? What data structures, algorithms, or engine internals are involved? Where is the implementation in the ClickHouse source tree (file/folder names) if you know?

2. **When to use vs avoid** — what concrete workloads does this help, and when would it hurt or be wrong? Give specific scale/latency trade-offs.

3. **Comparable features in other systems** — how does this compare with similar features in PostgreSQL, MySQL, BigQuery, Snowflake, Redshift, or DuckDB? Build my intuition by analogy.

4. **Common pitfalls and gotchas** — what trips engineers up in production? Subtle bugs, performance traps, surprising semantics?

5. **Worked example** — show me a small but realistic SQL or config example that demonstrates the concept end-to-end. Include the expected output where useful.

6. **Where to read more** — a short list of authoritative pointers (CH docs, blog posts, talks, source-code files).

Assume I have solid SQL fundamentals but I'm new to ClickHouse internals. Be technical but pragmatic; avoid marketing language.
Every column is compressed independently. Codecs can be stacked.
CREATE TABLE metrics (
    ts        DateTime CODEC(Delta(4), LZ4),    -- delta-of-delta, then LZ4
    cpu       UInt32   CODEC(T64, LZ4),         -- bit-pack, then LZ4
    rps       UInt64   CODEC(T64, ZSTD(3)),     -- bit-pack, then ZSTD level 3
    label     String   CODEC(ZSTD(6))           -- ZSTD level 6 for text
)
ENGINE = MergeTree ORDER BY ts;
Codec
Best for
LZ4 (default)
Anything; very fast, ~2× compression on text, more on integers.
ZSTD(level)
Larger compression than LZ4 (~30–50% smaller), slower. Levels 1–22.
Delta(N)
Monotonic series (timestamps, counters). Stores differences.
DoubleDelta
Timestamps with regular intervals (e.g. metrics every 1s).
Gorilla
Float time-series (Facebook's Gorilla algorithm).
T64
Integer columns where most values fit in fewer bits than the type.
LowCardinality(T)
Not a codec — a type wrapper for high-repetition strings.
The demo's extras.sql shows the actual ratios on identical data:
Delta + LZ4 reaches 0.5 % of raw on a monotonic timestamp column
(199× compression).
6. TTL — automatic data lifecycle
💬 Discuss with AI — click to view prompt
Paste into ChatGPT, Claude, Gemini, or any LLM chat.
I'm studying ClickHouse and working through the module "ClickHouse Fundamentals". I want to deeply understand the section: "TTL — automatic data lifecycle".

Here is a brief excerpt from the material I'm reading:

"""
Three flavours, all expressed on a date/time column: TTL runs **at merge time** in the background. It's not instant; for the demo we use `merge_with_ttl_timeout = 60` so the next `OPTIMIZE` actually purges old rows.
"""

Please explain this concept in depth. Cover:

1. **Core mechanics** — how does it actually work under the hood? What data structures, algorithms, or engine internals are involved? Where is the implementation in the ClickHouse source tree (file/folder names) if you know?

2. **When to use vs avoid** — what concrete workloads does this help, and when would it hurt or be wrong? Give specific scale/latency trade-offs.

3. **Comparable features in other systems** — how does this compare with similar features in PostgreSQL, MySQL, BigQuery, Snowflake, Redshift, or DuckDB? Build my intuition by analogy.

4. **Common pitfalls and gotchas** — what trips engineers up in production? Subtle bugs, performance traps, surprising semantics?

5. **Worked example** — show me a small but realistic SQL or config example that demonstrates the concept end-to-end. Include the expected output where useful.

6. **Where to read more** — a short list of authoritative pointers (CH docs, blog posts, talks, source-code files).

Assume I have solid SQL fundamentals but I'm new to ClickHouse internals. Be technical but pragmatic; avoid marketing language.
Three flavours, all expressed on a date/time column:
-- Whole-row TTL: delete rows after 90 days
ENGINE = MergeTree
ORDER BY (...)
TTL event_time + INTERVAL 90 DAY DELETE;

-- Column-level TTL: drop the column, keep the row
ENGINE = MergeTree ORDER BY (...)
( ...
    payload String TTL event_time + INTERVAL 30 DAY,
    ...);

-- Move-to-cold-disk TTL (with a multi-disk storage policy):
TTL event_time + INTERVAL 30 DAY TO VOLUME 'cold',
    event_time + INTERVAL 1 YEAR DELETE;
TTL runs at merge time in the background. It's not instant; for the
demo we use merge_with_ttl_timeout = 60 so the next OPTIMIZE actually
purges old rows.
7. The system.* tables you'll live in
💬 Discuss with AI — click to view prompt
Paste into ChatGPT, Claude, Gemini, or any LLM chat.
I'm studying ClickHouse and working through the module "ClickHouse Fundamentals". I want to deeply understand the section: "The system.* tables you'll live in".

Here is a brief excerpt from the material I'm reading:

"""
(no excerpt — section heading was "The system.* tables you'll live in")
"""

Please explain this concept in depth. Cover:

1. **Core mechanics** — how does it actually work under the hood? What data structures, algorithms, or engine internals are involved? Where is the implementation in the ClickHouse source tree (file/folder names) if you know?

2. **When to use vs avoid** — what concrete workloads does this help, and when would it hurt or be wrong? Give specific scale/latency trade-offs.

3. **Comparable features in other systems** — how does this compare with similar features in PostgreSQL, MySQL, BigQuery, Snowflake, Redshift, or DuckDB? Build my intuition by analogy.

4. **Common pitfalls and gotchas** — what trips engineers up in production? Subtle bugs, performance traps, surprising semantics?

5. **Worked example** — show me a small but realistic SQL or config example that demonstrates the concept end-to-end. Include the expected output where useful.

6. **Where to read more** — a short list of authoritative pointers (CH docs, blog posts, talks, source-code files).

Assume I have solid SQL fundamentals but I'm new to ClickHouse internals. Be technical but pragmatic; avoid marketing language.
These are CH's introspection surface. Memorise the shape of each.
Table
Use when…
system.tables
"What's the schema, ORDER BY, partition key?"
system.parts
"How many parts? Active vs inactive? Sizes? Compressed/uncompressed?"
One row per finished query: duration, rows read, memory.
system.query_thread_log
Per-thread breakdown of each query.
system.events
Lifetime counters: InsertedRows, MergedRows, etc.
system.metrics
Current values: connections, queued queries.
system.asynchronous_metrics
Sampled gauges: cache size, FS free.
system.processes
Currently-running queries (the SHOW PROCESSLIST equivalent).
system.settings
Every server/session setting and its current value.
system.disks / system.storage_policies
Multi-disk configuration.
SYSTEM FLUSH LOGS; forces the buffered logs to disk so the next SELECT
finds them.
8. The hands-on demo
💬 Discuss with AI — click to view prompt
Paste into ChatGPT, Claude, Gemini, or any LLM chat.
I'm studying ClickHouse and working through the module "ClickHouse Fundamentals". I want to deeply understand the section: "The hands-on demo".

Here is a brief excerpt from the material I'm reading:

"""
### What you get ### Run `./run.sh` self-bootstraps — if the container isn't up, it calls `up.sh`. ### Execution flow — what runs, in order | #  | Step                                | What happens                                                                                                                                                  | | 0  | self-bootstrap                      | If `m1-clickhouse` isn't responding to `/ping`, the script calls `up.sh` first. `up.sh` tears down any other demo module that's holding port 8123, then `docker compose up -d`. | | 1  | `setup.sql`...
"""

Please explain this concept in depth. Cover:

1. **Core mechanics** — how does it actually work under the hood? What data structures, algorithms, or engine internals are involved? Where is the implementation in the ClickHouse source tree (file/folder names) if you know?

2. **When to use vs avoid** — what concrete workloads does this help, and when would it hurt or be wrong? Give specific scale/latency trade-offs.

3. **Comparable features in other systems** — how does this compare with similar features in PostgreSQL, MySQL, BigQuery, Snowflake, Redshift, or DuckDB? Build my intuition by analogy.

4. **Common pitfalls and gotchas** — what trips engineers up in production? Subtle bugs, performance traps, surprising semantics?

5. **Worked example** — show me a small but realistic SQL or config example that demonstrates the concept end-to-end. Include the expected output where useful.

6. **Where to read more** — a short list of authoritative pointers (CH docs, blog posts, talks, source-code files).

Assume I have solid SQL fundamentals but I'm new to ClickHouse internals. Be technical but pragmatic; avoid marketing language.
./up.sh        # docker compose up -d, waits for /ping
./run.sh       # creates DB, inserts ~2M rows, runs demo queries
./down.sh      # docker compose down -v  (drops volumes)
./run.sh self-bootstraps — if the container isn't up, it calls up.sh.
Execution flow — what runs, in order
#
Step
What happens
0
self-bootstrap
If m1-clickhouse isn't responding to /ping, the script calls up.sh first. up.sh tears down any other demo module that's holding port 8123, then docker compose up -d.
1
setup.sql
Creates database m1 and one MergeTree table m1.events partitioned by month, ordered by (event_time, user_id), default index_granularity = 8192.
2
data.sql (~2M rows in 3 inserts)
Three INSERT … SELECT FROM numbers(...) (500k + 500k + 1M). Three on purpose: leaves three active parts so merges have something to do.
3
queries.sql
Eight observation queries: row count, system.parts, partitions/sizes, PK vs sorting key, OPTIMIZE FINAL, post-merge part count, date-range aggregation, and SYSTEM FLUSH LOGS + system.query_log to see how many rows the previous SELECT actually read.
wget -qO- 'http://localhost:8123/?query=SELECT count() FROM m1.events' from inside the container — should return 2000000.
What to look for
Step
What you should see
3 sequential INSERTs
3 active parts in system.parts initially.
Partition by toYYYYMM
Parts grouped under 202601, 202602, 202603.
OPTIMIZE TABLE … FINAL
Active part count drops; bytes per part rise.
system.tables
primary_key and sorting_key both event_time, user_id.
Codec comparison
Delta(4)+LZ4 ≈ 0.5 % of raw on monotonic timestamps; T64+LZ4 ≈ 3 % of raw on monotonic UInt64.
Date-range query
read_rows in query_log is much less than 2M — proof that PK pruning works.
9. Configuration reference (the demo's config)
💬 Discuss with AI — click to view prompt
Paste into ChatGPT, Claude, Gemini, or any LLM chat.
I'm studying ClickHouse and working through the module "ClickHouse Fundamentals". I want to deeply understand the section: "Configuration reference (the demo's config)".

Here is a brief excerpt from the material I'm reading:

"""
`configs/clickhouse-config.xml` is bind-mounted into the container under `/etc/clickhouse-server/config.d/00-custom.xml`. CH layers `config.d/` files on top of the base `config.xml`. > **Important on CH 26.x**: user-level settings (`max_memory_usage`, > `max_rows_to_read`, etc.) cannot live at the top level of `config.xml` > any more — they belong in `users.d/<file>.xml` under > `<profiles><default>...</default></profiles>`. Putting them at the top > level used to work; on 26.4+ the server refuses to start.
"""

Please explain this concept in depth. Cover:

1. **Core mechanics** — how does it actually work under the hood? What data structures, algorithms, or engine internals are involved? Where is the implementation in the ClickHouse source tree (file/folder names) if you know?

2. **When to use vs avoid** — what concrete workloads does this help, and when would it hurt or be wrong? Give specific scale/latency trade-offs.

3. **Comparable features in other systems** — how does this compare with similar features in PostgreSQL, MySQL, BigQuery, Snowflake, Redshift, or DuckDB? Build my intuition by analogy.

4. **Common pitfalls and gotchas** — what trips engineers up in production? Subtle bugs, performance traps, surprising semantics?

5. **Worked example** — show me a small but realistic SQL or config example that demonstrates the concept end-to-end. Include the expected output where useful.

6. **Where to read more** — a short list of authoritative pointers (CH docs, blog posts, talks, source-code files).

Assume I have solid SQL fundamentals but I'm new to ClickHouse internals. Be technical but pragmatic; avoid marketing language.
configs/clickhouse-config.xml is bind-mounted into the container under
/etc/clickhouse-server/config.d/00-custom.xml. CH layers config.d/
files on top of the base config.xml.
<clickhouse>
    <logger>
        <level>notice</level>
        <log>/var/log/clickhouse-server/clickhouse-server.log</log>
        <errorlog>/var/log/clickhouse-server/clickhouse-server.err.log</errorlog>
        <size>1000M</size><count>10</count>
    </logger>

    <!-- Persistent system logs: one row per query/part/merge. Without
         these, system.query_log and friends are empty after restart. -->
    <query_log><database>system</database><table>query_log</table></query_log>
    <query_thread_log><database>system</database><table>query_thread_log</table></query_thread_log>
    <part_log><database>system</database><table>part_log</table></part_log>

    <listen_host>0.0.0.0</listen_host>     <!-- accept TCP from anywhere -->
    <http_port>8123</http_port>
    <tcp_port>9000</tcp_port>
    <interserver_http_port>9009</interserver_http_port>

    <max_connections>4096</max_connections>
    <background_pool_size>16</background_pool_size>          <!-- merge workers -->
    <background_schedule_pool_size>16</background_schedule_pool_size>

    <path>/var/lib/clickhouse/</path>
    <tmp_path>/var/lib/clickhouse/tmp/</tmp_path>
    <user_files_path>/var/lib/clickhouse/user_files/</user_files_path>
</clickhouse>
Important on CH 26.x: user-level settings (max_memory_usage,
max_rows_to_read, etc.) cannot live at the top level of config.xml
any more — they belong in users.d/<file>.xml under
<profiles><default>...</default></profiles>. Putting them at the top
level used to work; on 26.4+ the server refuses to start.
10. Common pitfalls
💬 Discuss with AI — click to view prompt
Paste into ChatGPT, Claude, Gemini, or any LLM chat.
I'm studying ClickHouse and working through the module "ClickHouse Fundamentals". I want to deeply understand the section: "Common pitfalls".

Here is a brief excerpt from the material I'm reading:

"""
| Symptom                                                      | Cause                                                                | Fix                                                                                       | | Inserts get progressively slower; CPU spent in merges        | Many small inserts → too many parts.                                 | Batch inserts (1k–100k rows). Use Buffer engine *only* if you can't.                      | | `Too many parts (N). Merges are processing significantly slower than inserts` | Same as above, but now hard-failing.                | Slow dow...
"""

Please explain this concept in depth. Cover:

1. **Core mechanics** — how does it actually work under the hood? What data structures, algorithms, or engine internals are involved? Where is the implementation in the ClickHouse source tree (file/folder names) if you know?

2. **When to use vs avoid** — what concrete workloads does this help, and when would it hurt or be wrong? Give specific scale/latency trade-offs.

3. **Comparable features in other systems** — how does this compare with similar features in PostgreSQL, MySQL, BigQuery, Snowflake, Redshift, or DuckDB? Build my intuition by analogy.

4. **Common pitfalls and gotchas** — what trips engineers up in production? Subtle bugs, performance traps, surprising semantics?

5. **Worked example** — show me a small but realistic SQL or config example that demonstrates the concept end-to-end. Include the expected output where useful.

6. **Where to read more** — a short list of authoritative pointers (CH docs, blog posts, talks, source-code files).

Assume I have solid SQL fundamentals but I'm new to ClickHouse internals. Be technical but pragmatic; avoid marketing language.
Symptom
Cause
Fix
Inserts get progressively slower; CPU spent in merges
Many small inserts → too many parts.
Batch inserts (1k–100k rows). Use Buffer engine only if you can't.
Too many parts (N). Merges are processing significantly slower than inserts
Same as above, but now hard-failing.
Slow down inserts; raise parts_to_throw_insert only as a temporary lifeline.
Tiny query reads millions of rows
PK doesn't cover the filter; or filter isn't on a PK-prefix column.
Re-shape ORDER BY, or add a skip-index/projection (Module 6).
Memory limit exceeded
Aggregation needs more than max_memory_usage (default 10 GB).
Raise the limit, or use max_bytes_before_external_group_by to spill to disk.
Code: 60. Unknown table 'system.query_log'
First SELECT on query_log arrives before its periodic flush.
SYSTEM FLUSH LOGS; before the SELECT.
INSERT VALUES hangs forever via clickhouse-client
--multiquery --query "..." + open stdin → CH waits for more data.
Pipe the SQL via printf %s "$SQL" | clickhouse-client (this demo does that already).
11. Talking points for the live session
💬 Discuss with AI — click to view prompt
Paste into ChatGPT, Claude, Gemini, or any LLM chat.
I'm studying ClickHouse and working through the module "ClickHouse Fundamentals". I want to deeply understand the section: "Talking points for the live session".

Here is a brief excerpt from the material I'm reading:

"""
1. **Why columnar?** Walk through "SELECT avg(revenue) FROM events WHERE country = 'US'": only 2 columns are read; rows are processed in batches; the entire query touches ~kilobytes of memory. 2. **Why merges?** Show `system.merges` mid-INSERT — there's almost always a background job running. 3. **Sorting key vs primary key.** Most tables use only `ORDER BY` and let the PK equal it. The split is a tuning knob for the rare case where ORDER BY has high-cardinality trailing columns you don't want in the index. 4. **`index_granularity = 8192`** is why the PK is tiny. Demonstrate by showing `primar...
"""

Please explain this concept in depth. Cover:

1. **Core mechanics** — how does it actually work under the hood? What data structures, algorithms, or engine internals are involved? Where is the implementation in the ClickHouse source tree (file/folder names) if you know?

2. **When to use vs avoid** — what concrete workloads does this help, and when would it hurt or be wrong? Give specific scale/latency trade-offs.

3. **Comparable features in other systems** — how does this compare with similar features in PostgreSQL, MySQL, BigQuery, Snowflake, Redshift, or DuckDB? Build my intuition by analogy.

4. **Common pitfalls and gotchas** — what trips engineers up in production? Subtle bugs, performance traps, surprising semantics?

5. **Worked example** — show me a small but realistic SQL or config example that demonstrates the concept end-to-end. Include the expected output where useful.

6. **Where to read more** — a short list of authoritative pointers (CH docs, blog posts, talks, source-code files).

Assume I have solid SQL fundamentals but I'm new to ClickHouse internals. Be technical but pragmatic; avoid marketing language.
Why columnar? Walk through "SELECT avg(revenue) FROM events
WHERE country = 'US'": only 2 columns are read; rows are processed in
batches; the entire query touches ~kilobytes of memory.
Why merges? Show system.merges mid-INSERT — there's almost always
a background job running.
Sorting key vs primary key. Most tables use only ORDER BY and let
the PK equal it. The split is a tuning knob for the rare case where
ORDER BY has high-cardinality trailing columns you don't want in the
index.
index_granularity = 8192 is why the PK is tiny. Demonstrate by
showing primary.idx size vs row count.
OPTIMIZE FINAL is a debugging convenience. Never run it from
cron — it'll take down a busy server.
Append-only mindset. Every INSERT writes a fresh part. Conventional
"UPDATE" is done via Replacing/Collapsing engines (Module 2) or
ALTER TABLE … UPDATE (which writes an async mutation, not an UPDATE).
12. Container ports
💬 Discuss with AI — click to view prompt
Paste into ChatGPT, Claude, Gemini, or any LLM chat.
I'm studying ClickHouse and working through the module "ClickHouse Fundamentals". I want to deeply understand the section: "Container ports".

Here is a brief excerpt from the material I'm reading:

"""
| Service        | Container port | Host port | | HTTP           | 8123           | 8123      | | Native (TCP)   | 9000           | 9000      | | Inter-server   | 9009           | (not exposed; cluster-only) | The default user is loopback-only when no `CLICKHOUSE_PASSWORD` is set, so the demo's HTTP smoke test runs `wget` from *inside* the container. Production: define users in `users.d/` (Module 5 walks through this).
"""

Please explain this concept in depth. Cover:

1. **Core mechanics** — how does it actually work under the hood? What data structures, algorithms, or engine internals are involved? Where is the implementation in the ClickHouse source tree (file/folder names) if you know?

2. **When to use vs avoid** — what concrete workloads does this help, and when would it hurt or be wrong? Give specific scale/latency trade-offs.

3. **Comparable features in other systems** — how does this compare with similar features in PostgreSQL, MySQL, BigQuery, Snowflake, Redshift, or DuckDB? Build my intuition by analogy.

4. **Common pitfalls and gotchas** — what trips engineers up in production? Subtle bugs, performance traps, surprising semantics?

5. **Worked example** — show me a small but realistic SQL or config example that demonstrates the concept end-to-end. Include the expected output where useful.

6. **Where to read more** — a short list of authoritative pointers (CH docs, blog posts, talks, source-code files).

Assume I have solid SQL fundamentals but I'm new to ClickHouse internals. Be technical but pragmatic; avoid marketing language.
Service
Container port
Host port
HTTP
8123
8123
Native (TCP)
9000
9000
Inter-server
9009
(not exposed; cluster-only)
The default user is loopback-only when no CLICKHOUSE_PASSWORD is set,
so the demo's HTTP smoke test runs wget from inside the container.
Production: define users in users.d/ (Module 5 walks through this).
13. Going deeper
💬 Discuss with AI — click to view prompt
Paste into ChatGPT, Claude, Gemini, or any LLM chat.
I'm studying ClickHouse and working through the module "ClickHouse Fundamentals". I want to deeply understand the section: "Going deeper".

Here is a brief excerpt from the material I'm reading:

"""
- **Module 2** — every `*MergeTree` variant in detail. - **Module 6** — the same primary-key/projection knobs, with measured query timings on 60M rows. - **ClickHouse docs** — <https://clickhouse.com/docs> (especially the MergeTree, Codecs, and System Tables sections). When you're comfortable with this module, tear down (`./down.sh`) and move to Module 2.
"""

Please explain this concept in depth. Cover:

1. **Core mechanics** — how does it actually work under the hood? What data structures, algorithms, or engine internals are involved? Where is the implementation in the ClickHouse source tree (file/folder names) if you know?

2. **When to use vs avoid** — what concrete workloads does this help, and when would it hurt or be wrong? Give specific scale/latency trade-offs.

3. **Comparable features in other systems** — how does this compare with similar features in PostgreSQL, MySQL, BigQuery, Snowflake, Redshift, or DuckDB? Build my intuition by analogy.

4. **Common pitfalls and gotchas** — what trips engineers up in production? Subtle bugs, performance traps, surprising semantics?

5. **Worked example** — show me a small but realistic SQL or config example that demonstrates the concept end-to-end. Include the expected output where useful.

6. **Where to read more** — a short list of authoritative pointers (CH docs, blog posts, talks, source-code files).

Assume I have solid SQL fundamentals but I'm new to ClickHouse internals. Be technical but pragmatic; avoid marketing language.
Module 2 — every *MergeTree variant in detail.
Module 6 — the same primary-key/projection knobs, with measured
query timings on 60M rows.
ClickHouse docs — https://clickhouse.com/docs (especially the
MergeTree, Codecs, and System Tables sections).
When you're comfortable with this module, tear down (./down.sh) and
move to Module 2.
📊 ClickHouse Knowledge Transfer
Module 1 of 10 | Duration: 6-8 weeks total
Created for comprehensive ClickHouse training | 2026